
What if satellites worked like a flashlight that never needs a bulb, seeing through clouds and at night?
Synthetic aperture radar (SAR) satellites do something close: they send microwave pulses to Earth and read the echoes, so weather or darkness don’t stop imaging.
In this post I’ll explain how SAR works in plain terms and show real-world uses, from flood mapping and disaster response to crop and soil monitoring, maritime surveillance, and measuring ground shifts with millimeter precision.
You’ll learn what SAR can do that optical sensors can’t.
Core Uses of Synthetic Aperture Radar Satellites Explained
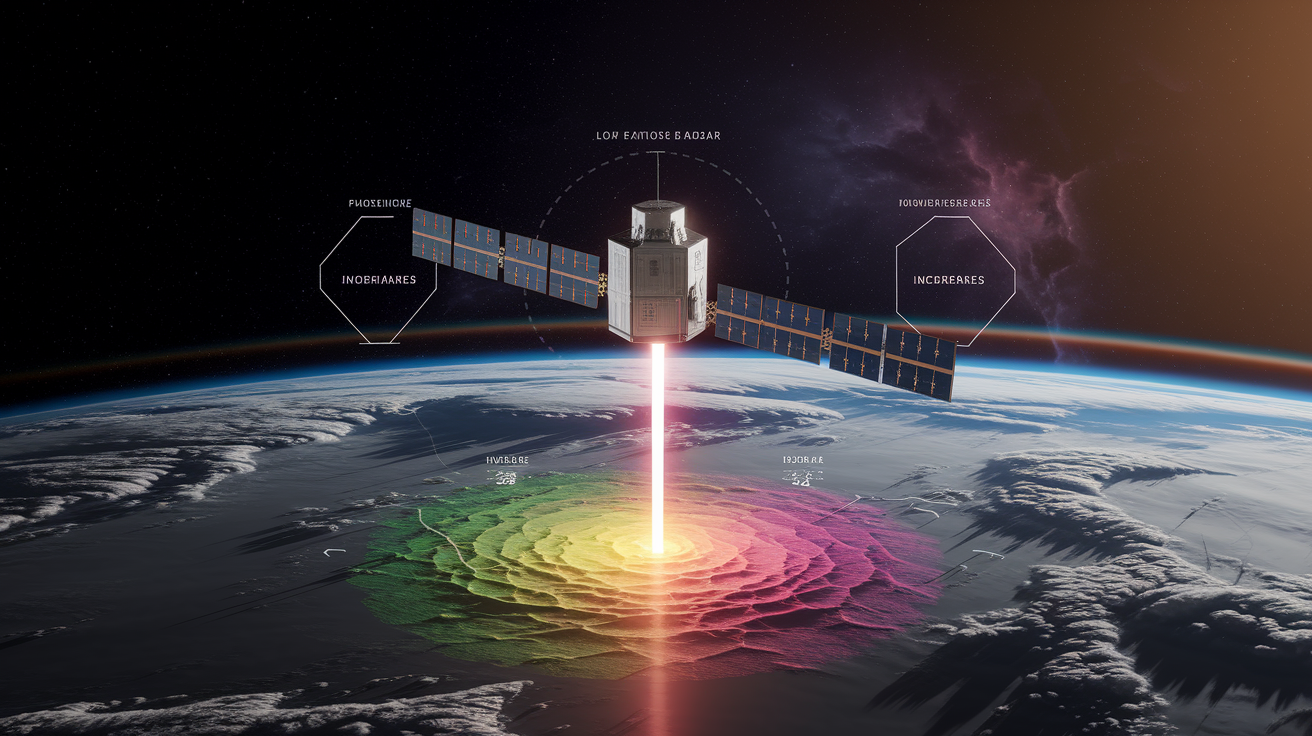
Synthetic aperture radar satellites fire microwave pulses at Earth and measure what bounces back, building images of the ground whether there’s sunlight or not. Clouds, smoke, complete darkness? None of it matters. That’s what sets SAR apart from optical satellites, which just sit there useless when the sky’s overcast or the sun goes down. SAR wavelengths run anywhere from about 3 cm out to several meters, letting the radar slip through certain materials and pick up surface roughness or moisture shifts that visible light can’t touch.
Military teams, disaster crews, environmental scientists, crop analysts, and maritime patrols all lean on SAR imaging. They’re watching places where weather or night would kill a regular camera feed, tracking changes without waiting days for clear skies, and measuring physical properties optical sensors completely miss.
Flood mapping during heavy storms shows you exactly why SAR matters. Optical satellites? They’re staring at cloud tops. SAR pulses punch straight through and show water spreading across thousands of square kilometers in one pass. Ship detection works the same way. Radar spots metal hulls and superstructures through fog or total darkness, and when smooth surfaces meet at 90° angles you get double-bounce reflections that light up vessels like beacons. Then there’s interferometric SAR, or InSAR. Compare repeat passes and you can measure ground displacement down to millimeters or centimeters, catching subsidence under cities, slow volcanic swelling, or sudden earthquake shifts.
How Synthetic Aperture Radar Imaging Enables Key Applications
Real aperture radar resolution in the azimuth direction (that’s along-track) depends on antenna length. Longer antenna, tighter beam, better resolution. Building an antenna tens or hundreds of meters long in space isn’t happening, so SAR cheats by using platform motion instead. The satellite moves forward, transmitting pulses the whole time a ground target stays in the radar beam. Software stitches those echoes together as if they came from one massive antenna. The synthetic aperture you get from that motion delivers sharp azimuth resolution without needing giant hardware.
Pixel brightness in a SAR image comes down to how energy scatters back. Smooth surface relative to the wavelength? You get specular reflection, the pulse bounces away like a mirror and almost nothing comes back to the satellite. That’s why calm water looks dark. Rough surface compared to the wavelength? Diffuse scattering spreads energy everywhere and you get a strong return. Smooth surfaces meeting at roughly 90° create double-bounce returns: pulse hits a wall, then the ground, and comes straight back with serious intensity. Trihedral corners (buildings, ship structures) can bounce even brighter through triple reflections.
SAR imaging works because of five things:
Cloud and precipitation penetration: microwaves pass right through water droplets and cloud layers, so storms and monsoon seasons don’t stop observation.
Night imaging: radar makes its own light, image quality doesn’t care where the sun is.
Sensitivity to surface roughness: texture differences at centimeter-to-meter scales create brightness changes that reveal plowed fields, fresh pavement, or different ice types.
Sensitivity to moisture: high water content changes dielectric properties, altering backscatter so you can map soil moisture or flood extent.
Coherent phase for displacement measurement: SAR records amplitude and phase, so repeat-pass interferometry catches ground motion at sub-centimeter scales.
Disaster Monitoring with SAR: Floods, Earthquakes, and Landslides
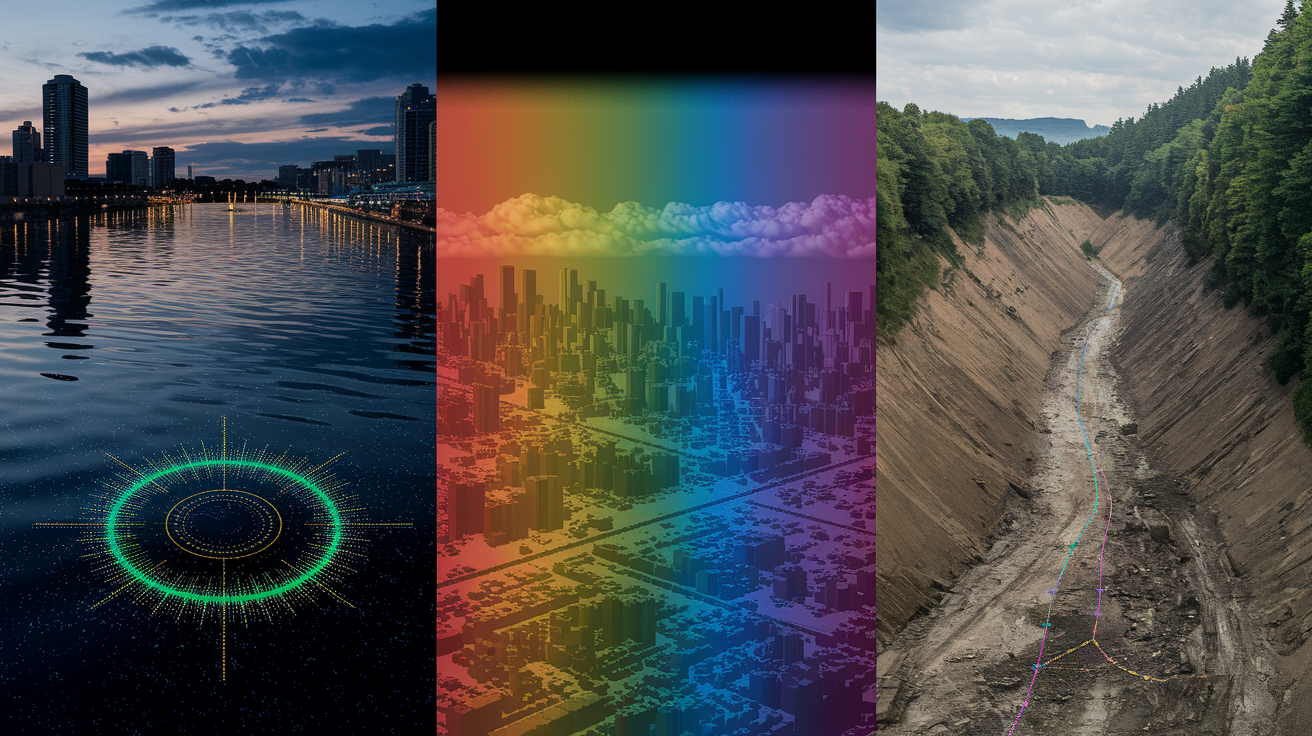
Storms that bring floods also bring thick clouds that block optical satellites for days. SAR cuts through and maps standing water in hours, feeding evacuation routes and resource decisions. Water surfaces show up dark when calm (specular reflection away from the sensor) or reveal texture from rough flow. Analysts outline flooded zones even while rain keeps falling. Flood mapping is SAR’s most proven disaster use because the same conditions causing the flood guarantee optical won’t work.
Earthquake damage assessment gets faster and sharper with InSAR. Compare radar phase from a pass before the quake with one after and you get an interferogram showing ground displacement. Precision typically hits millimeter-to-centimeter scale between passes, mapping fault slip, crustal deformation, and settlement patterns in detail. The 2011 Tohoku earthquake in Japan moved ground several meters, visible in radar interferograms within days, helping scientists understand fault mechanics and spot at-risk infrastructure.
Landslide monitoring and volcano inflation tracking run on time-series InSAR. Slopes creeping slowly or volcanic domes swelling can be caught long before failure or eruption, giving early warning. SAR’s cloud penetration matters especially in tropical volcanic areas where weather would leave optical monitoring full of gaps. Repeat-pass coherence holds for weeks to months in stable ground, letting analysts track millimeter-scale trends that signal escalating hazards.
| Disaster Type | SAR Benefit | Typical Resolution/Precision |
|---|---|---|
| Floods | All-weather inundation mapping during storms | ~5–100 m spatial resolution (wide-area modes) |
| Earthquakes | Ground displacement measurement via InSAR | mm–cm deformation precision |
| Landslides | Slow creep detection and slope monitoring | mm–cm displacement over weeks to months |
| Volcano Inflation | Early deformation detection beneath cloud cover | mm–cm vertical/horizontal displacement |
Environmental and Climate Uses of SAR Imaging
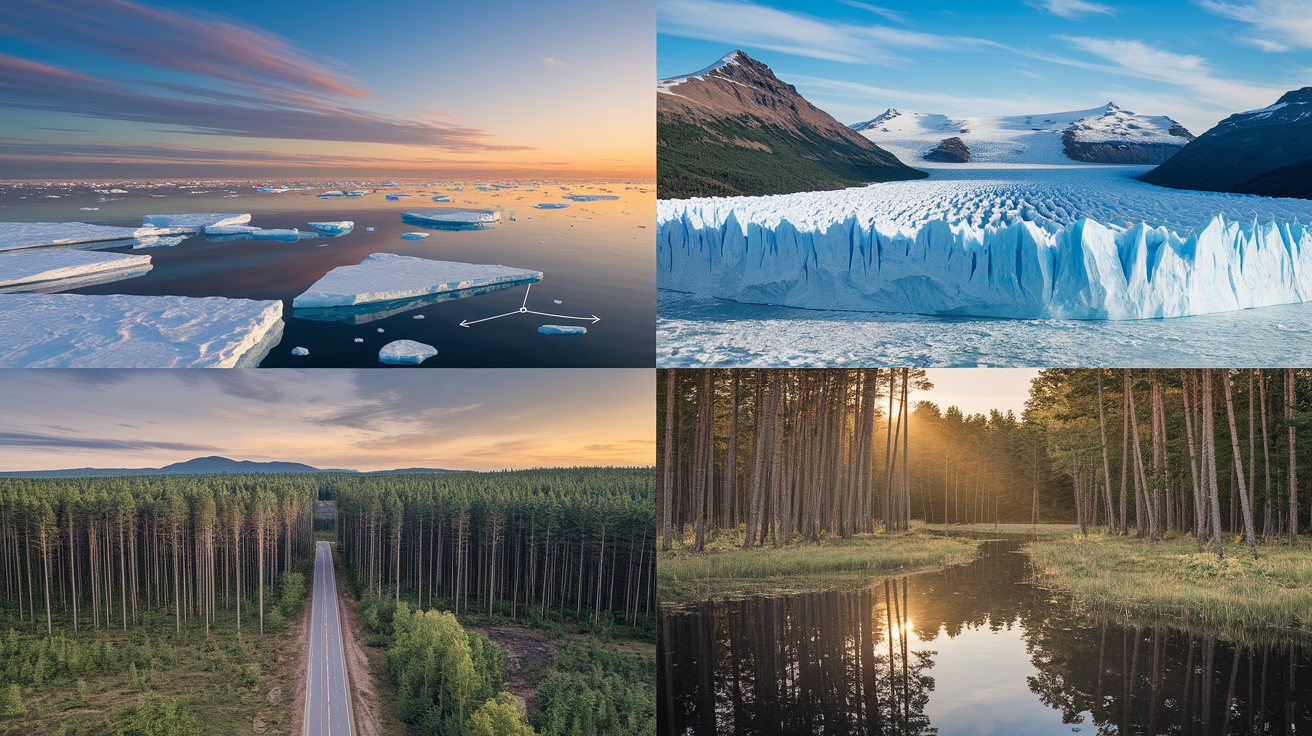
SAR tracks ecosystem changes across time scales and places where optical satellites get stuck. Sea ice extent and type mapping in polar regions happens year-round because SAR operates through polar night without sunlight. Different ice types (first-year, multiyear, open water) produce distinct backscatter signatures from surface roughness and salinity, helping scientists monitor Arctic and Antarctic changes with consistent coverage. Glacier movement gets measured by tracking surface features between passes or using InSAR coherence to detect flow velocity, revealing speed changes tied to climate forcing even when clouds hide the ice for weeks.
Deforestation and land use change detection benefit from SAR’s penetration into vegetation and its read on forest structure. L-band radar, with wavelengths around 15–30 cm, can slip through tree canopies and catch biomass changes hidden under leafy cover in optical imagery. Wetland mapping uses SAR’s sensitivity to surface water and saturated soils. Flooded vegetation creates a characteristic double-bounce return (water surface plus vertical stems), making wetlands bright and allowing seasonal tracking through tropical cloud cover.
SAR supports environmental work through:
Deforestation change detection: repeat passes show logging roads, cleared patches, and regrowth by changes in backscatter intensity and texture.
Glacier and ice movement: InSAR measures ice velocity and calving-front retreat, tracking mass balance in ice sheets and mountain glaciers.
Wetland extent and seasonal flooding: radar spots standing water beneath vegetation, mapping inundation cycles critical for carbon storage and biodiversity.
Biomass estimation: L-band backscatter correlates with forest biomass, feeding carbon stock assessments in tropical and boreal ecosystems.
Agriculture Monitoring with Radar: Crops, Soil Moisture, and Precision Farming
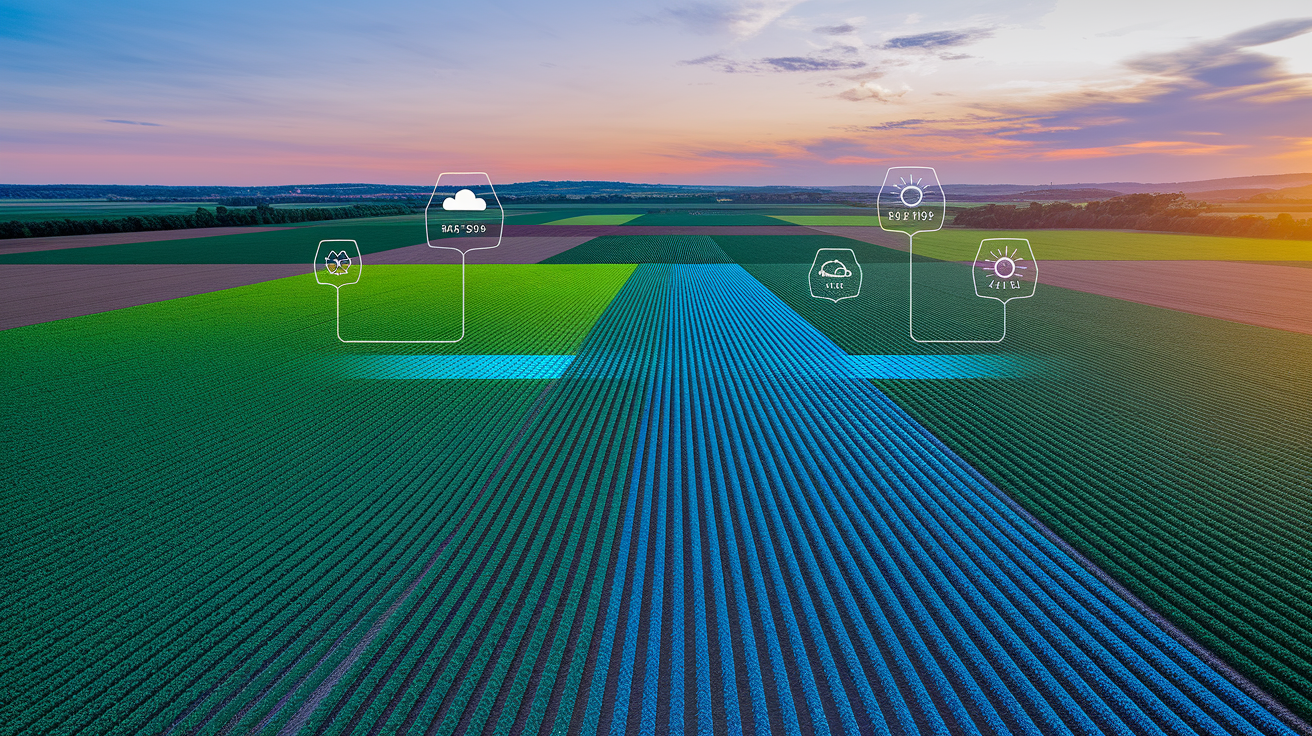
Soil moisture drives agricultural productivity, and SAR offers a way to estimate it from space. Water has a high dielectric constant, so wet soil returns stronger radar signals than dry soil. Analyzing backscatter intensity and polarization ratios maps relative soil moisture across fields, guiding irrigation and identifying drainage problems. This matters especially during planting and early growth when cloud cover blocks optical sensors in temperate and tropical farming regions.
Crop structure and condition monitoring use SAR’s sensitivity to plant architecture. As crops grow, stems, leaves, and grain heads change scattering behavior. Radar tracks these structural shifts through the season, complementing optical vegetation indices. SAR classification algorithms distinguish crop types from temporal backscatter signatures, helping forecast yields and detect planting or harvest timing. Because SAR works through clouds, it fills data gaps during critical growth windows optical satellites miss.
Precision farming integrations are starting to appear as SAR data becomes easier to access. Farmers and agronomic advisors combine radar soil moisture maps with optical NDVI and weather data to fine-tune fertilizer application, adjust planting density, and schedule irrigation. SAR’s all-weather reliability means the data stream doesn’t stop during rainy periods when decisions are most urgent, offering consistency optical alone can’t match.
Maritime Surveillance and Ocean Monitoring with SAR
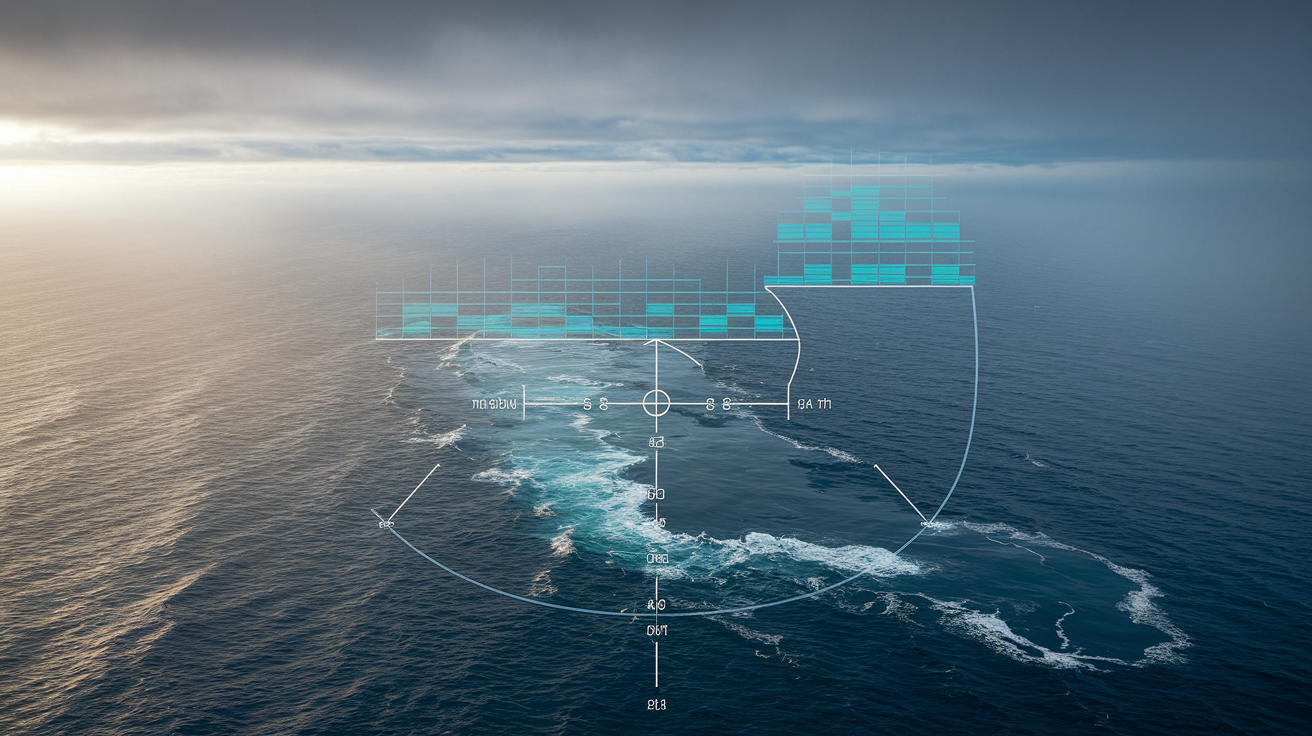
SAR detects ships as bright targets against darker ocean background because metal hulls and superstructures create strong double-bounce and trihedral returns. Fog, darkness, rough seas? Radar still identifies vessel positions, measures ship size from the signature, and tracks movements over time. Maritime authorities use SAR imagery to monitor shipping lanes, enforce fishing regulations, and detect suspicious or unreported vessel activity when combined with Automatic Identification System transponder data.
Oil spills show up as dark patches on SAR images because thin oil film dampens short ocean waves, creating a smoother surface that reflects radar energy away from the sensor. That backscatter reduction makes spills visible even at night or through clouds, enabling rapid response. SAR can’t distinguish oil from other smoothing agents (natural slicks or algae), so analysts cross-check with wind and oceanographic data, but the all-weather detection gives response teams early alerts optical satellites might miss during bad weather.
Maritime SAR applications include:
Ship detection and identification: bright radar returns from metal vessels let automated algorithms flag all ships in wide swaths, day or night.
Oil spill mapping: reduced backscatter from smooth films reveals spill extent and drift, supporting containment planning.
Iceberg and sea ice tracking: radar detects ice features in polar shipping lanes, improving navigation safety.
Illegal fishing detection: cross-referencing SAR detections with AIS transponder logs reveals “dark” vessels operating without identification.
Wave and sea state monitoring: SAR measures ocean wave height and direction, feeding into weather models and maritime safety forecasts.
Terrain Mapping and Ground Deformation: How SAR Measures Earth’s Movement
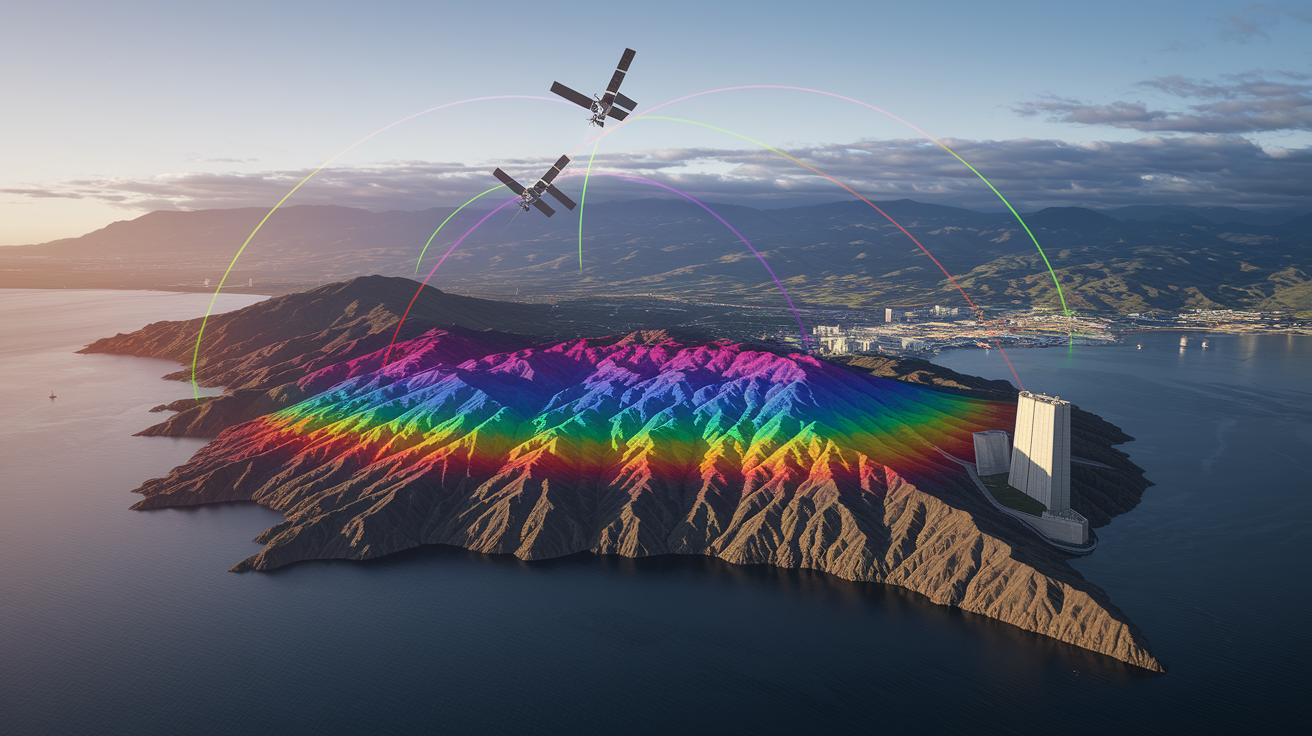
Digital elevation models can be generated from SAR using interferometry or stereo techniques. The TanDEM-X mission, launched in 2010 alongside TerraSAR-X (launched June 15, 2007), flew two satellites in close formation to collect simultaneous radar images from slightly different positions. Phase difference between the two signals reveals elevation, producing a global DEM with vertical accuracy in the meter range. These datasets support terrain analysis, flood modeling, and infrastructure planning in regions where ground surveys aren’t practical.
Ground deformation measurement via InSAR reaches millimeter-to-centimeter precision by comparing phase from repeat passes over the same area. Urban subsidence from groundwater extraction, oil and gas production, or tunneling can be tracked continuously, identifying buildings and roads at risk of structural damage. Volcano monitoring uses InSAR time series to detect slow inflation or deflation of magma chambers, providing early warning signals before eruptions. Dam deformation and reservoir-induced subsidence get monitored too, with analysts measuring movement at the dam face and surrounding slopes to keep things safe.
Infrastructure monitoring extends to pipelines, bridges, and mine tailings. SAR can catch millimeter-scale shifts in pipeline routes crossing unstable ground, flagging sections that might need repair before leaks happen. Bridge decks and approach embankments can be watched for settlement or unexpected movement, and tailings dams at mines are monitored for deformation that might come before catastrophic failure. Because SAR works through clouds and doesn’t need ground instrumentation, it offers a persistent, area-wide safety net complementing traditional surveying.
Sensor Bands, Resolution, and Wavelength Choices in SAR Satellites
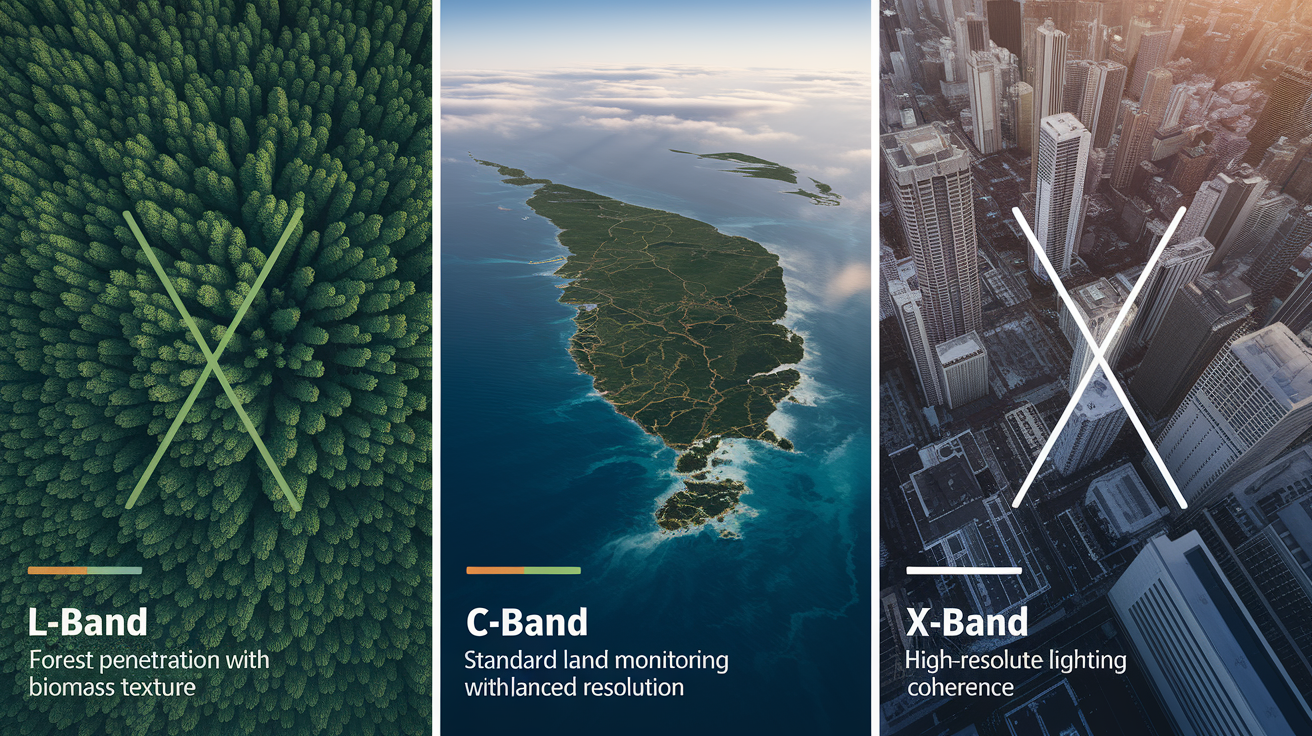
SAR missions pick wavelength bands based on the balance between resolution, penetration, and coherence. L-band radar, with wavelengths roughly 15–30 cm, penetrates vegetation canopies and maintains coherence over longer time intervals, making it good for forest biomass estimation, soil moisture retrieval beneath crops, and long-baseline InSAR in vegetated or slow-changing terrain. C-band, around 4–8 cm wavelength (Sentinel-1 operates at about 5.405 GHz, roughly 5.5 cm), gets used widely for land and ocean monitoring because it strikes a practical balance between detail and area coverage, and C-band systems have mature processing chains and large archives.
X-band radar, with wavelengths around 2–3 cm, delivers the highest spatial resolution and is preferred for detailed surveillance, urban mapping, and ship detection where sub-meter detail is needed. Spotlight modes on X-band satellites can hit resolutions finer than 1 meter, revealing individual vehicles and small structures. The tradeoff is X-band decorrelates more quickly in vegetation and offers less penetration into canopies or soil, limiting its use for biomass or soil moisture applications compared to longer wavelengths.
Band comparisons:
L-band (~15–30 cm): Best for vegetation penetration, biomass estimation, and maintaining interferometric coherence over weeks to months. Used in ALOS-2 (launched May 24, 2014).
C-band (~4–8 cm): Standard for operational land and sea monitoring. Balances resolution and coverage. Used in Sentinel-1 and RADARSAT missions.
X-band (~2–3 cm): Highest resolution for detailed imaging. Preferred for defense, ship detection, and urban infrastructure. Used in TerraSAR-X and COSMO-SkyMed.
Resolution modes: Spotlight modes reach ~0.25–1 m. Stripmap modes typically ~1–10 m. Wide-swath ScanSAR modes ~10–100 m, trading detail for area coverage.
Major SAR Satellite Missions and Their Capabilities
Sentinel-1 is the workhorse of operational SAR monitoring. Sentinel-1A launched on April 3, 2014, and Sentinel-1B launched on April 25, 2016, forming a two-satellite constellation that provided systematic global coverage with a combined revisit time around six days at mid-latitudes. Both satellites carry C-band radar and operate in multiple modes, delivering free and open data supporting disaster response, land monitoring, and maritime surveillance worldwide. Sentinel-1B’s mission ended in 2022, and Sentinel-1C is planned to restore the constellation.
TerraSAR-X, launched June 15, 2007, pioneered high-resolution commercial X-band imaging. Its twin, TanDEM-X, launched June 21, 2010, flies in close formation to enable single-pass interferometry for DEM generation. Together they produced a global elevation model and continue providing sub-meter resolution imagery for defense, infrastructure, and science. RADARSAT-2, launched December 14, 2007, offers C-band imaging with multiple polarizations and beam modes, widely used in Canada and internationally for ice monitoring, maritime surveillance, and disaster management.
ALOS-2 (Daichi-2), launched May 24, 2014, carries an L-band SAR and continues Japan’s tradition of long-wavelength radar missions. L-band’s penetration and coherence make ALOS-2 valuable for forestry, geology, and InSAR over vegetated terrain. Commercial small-satellite SAR constellations have emerged in recent years, with companies deploying fleets of compact X or C-band satellites aiming for daily or sub-daily revisit over priority regions, driven by demand for near-real-time monitoring in maritime, agriculture, and defense markets.
Mission examples with key details:
Sentinel-1A (launched 2014-04-03) and Sentinel-1B (launched 2016-04-25): C-band, ~6-day combined revisit, free and open data, operational land and ocean monitoring.
TerraSAR-X (launched 2007-06-15): X-band, <1 m resolution in spotlight mode, commercial and scientific high-detail imaging.
RADARSAT-2 (launched 2007-12-14): C-band, multiple polarizations, maritime and ice monitoring focus.
ALOS-2 (launched 2014-05-24): L-band, vegetation penetration, long-coherence InSAR for forestry and geology.
Final Words
Right in the middle of storms, night operations, and cloudy skies, SAR satellites keep watching using microwave pulses that cut through clouds, smoke, and darkness.
They serve military, disaster response, environmental monitoring, agriculture, maritime safety, and precise ground-deformation work, including flood mapping under cloud cover, ship detection, and mm-cm InSAR measurements as common examples.
If you’re asking what is synthetic aperture radar satellite used for, the short answer is: anywhere reliable, day-and-night, all-weather radar imaging is needed. That steady view helps teams and scientists act faster and smarter.
FAQ
Q: What is the purpose of synthetic aperture radar?
A: The purpose of synthetic aperture radar is to provide active microwave imaging day and night, through clouds and smoke, to map surface roughness, moisture, terrain, disasters, ships, and millimeter‑to‑centimeter ground deformation.
Q: Is SAR better than LiDAR?
A: SAR is not universally better than LiDAR; SAR excels at all‑weather, day‑night imaging and sensing moisture and surface structure, while LiDAR delivers higher‑resolution 3D elevation and vegetation structure under clearer conditions.
Q: Does the USA have SAR satellites?
A: The USA operates and supports SAR satellites: government agencies and commercial firms run missions, for example the NASA‑ISRO NISAR partnership and U.S. companies like Capella Space deploy small SAR constellations.
Q: How deep can SAR radar penetrate?
A: SAR radar penetration depends on wavelength and material: L‑band can reach meters in dry snow, P‑band several meters in dry soil, C/X bands only centimeters, and SAR cannot see through solid rock or deep underground.