
What if bright and dark patches in radar images are really a map of surface roughness, not just different materials?
SAR backscatter is the portion of the radar pulse that returns to the sensor, and its brightness directly reflects how the surface scatters at the radar’s wavelength.
This post explains that link: why small bumps make a scene bright, why smooth areas go dark, and how wavelength, incidence angle, polarization, and geometry change what you see.
You’ll get clear, practical ways to read brightness in SAR images.
Understanding SAR Backscatter and Surface Roughness

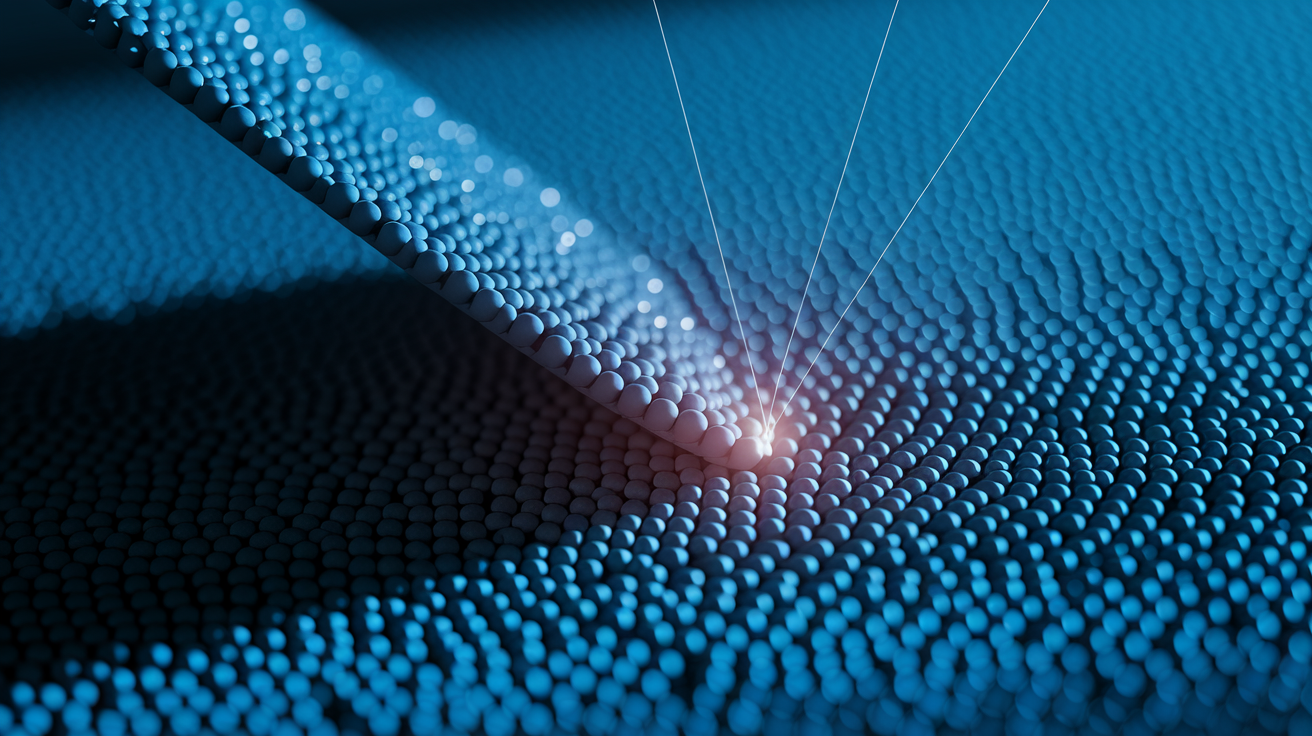
SAR backscatter is the portion of the transmitted radar pulse that bounces back toward the sensor. When the radar wave hits a surface, some energy scatters everywhere and some comes straight back. The strength of that return signal shows up as brightness in the final image. What drives these differences? Surface roughness measured at the radar wavelength scale, not the kind of roughness you’d feel with your hand.
Bright pixels mean strong backscatter. Dark pixels mean weak backscatter.
Rough surfaces at the radar wavelength create diffuse scattering. Energy gets sent in multiple directions, including back toward the sensor, and you get brighter pixels. Think of a gravel road under radar. The small stones and pits are about the same size as the centimeter-scale radar wavelength, so the wave bounces off edges and facets all over the place. Some of that scattered energy returns to the antenna and raises the backscatter intensity. Smooth surfaces act like mirrors. A calm lake or freshly paved runway reflects the radar pulse away at the specular angle, the same way a mirror reflects light. Almost no energy comes back to the sensor. The result? A dark pixel. This specular reflection rule breaks down when the surface tilts toward the radar or contains vertical elements that create corner reflectors. But for horizontal smooth targets the dark signature holds up.
Wavelength-scale roughness is what matters here. A surface that looks rough to your eye might be smooth to a long-wavelength radar. And the reverse is true too. The rule of thumb: surfaces with height variations smaller than about one-tenth of the radar wavelength behave as smooth and produce specular reflection. Surfaces with variations larger than roughly one wavelength scatter diffusely. For example, X-band radar at 3 cm wavelength sees a 5 mm ripple as smooth. But L-band at 23 cm treats that same ripple as perfectly flat. This wavelength dependency means the same field can look bright in X-band and dark in L-band if the roughness features fall between those two scales.
Key roughness-controlled backscatter responses:
Diffuse scattering from rough surfaces. Height variations at or above the wavelength scale scatter radar energy back toward the sensor, creating bright returns.
Specular reflection from smooth surfaces. Flat, smooth targets reflect energy away from the sensor like a mirror and produce dark pixels.
Volume scattering in layered media. When the radar penetrates into vegetation or porous material, internal structures scatter the wave multiple times. This often increases total backscatter and produces moderate to bright tones.
Double-bounce from vertical structures. Radar reflects off a horizontal surface, then off a vertical wall, and back to the sensor in a corner-reflector geometry. You get very bright returns regardless of individual surface roughness.
Wavelength-dependent penetration and roughness sensitivity. Longer wavelengths penetrate deeper and respond to larger-scale roughness. Shorter wavelengths interact mainly with surface texture and fine details.
Physical Factors That Influence Backscatter Intensity
Incidence angle is the angle between the radar beam and the surface normal. It controls how much energy couples into the surface versus how much reflects away. At steep incidence angles (beam nearly perpendicular to the ground), even moderately rough surfaces can produce strong diffuse returns because the geometry favors backscatter over specular escape. At shallow incidence angles (beam grazing the surface), rough surfaces still scatter diffusely but the total received power drops. Less energy interacts with the surface facets that point back toward the sensor. Smooth surfaces remain dark across most incidence angles because specular reflection dominates. But if the surface tilts to match the specular angle for that particular beam geometry, brightness can spike.
Terrain slope interacts directly with incidence angle. An upward-facing slope appears brighter because the local incidence angle decreases. A downward-facing slope darkens or disappears into shadow. When you’re interpreting brightness, always check whether observed changes come from roughness differences or simply from changing slope and incidence geometry.
Radar wavelength determines which surface features matter. X-band operates around 3 cm wavelength, so surface bumps and texture smaller than about 3 mm appear smooth. Features larger than a few centimeters scatter strongly. L-band uses a 23 cm wavelength, which makes it insensitive to fine sand grains or small pebbles but responsive to larger rocks, plowed furrows, and vegetation stems. Longer wavelengths also penetrate deeper into dry soil and vegetation canopy. An L-band pulse can reach through forest leaves to interact with branches and trunks, producing volume scattering and brighter returns even when the canopy surface alone would be smooth at that wavelength. X-band stops at the canopy top, so the backscatter reflects mainly surface leaf texture and small-scale roughness.
This penetration difference means the same forest can show very different brightness in X-band versus L-band. Not because roughness changed, but because the radar is sampling different layers and spatial scales.
Polarization adds another dimension to roughness interpretation. That’s the orientation of the transmitted and received electromagnetic wave. VV polarization transmits and receives vertically oriented waves. HH uses horizontal. VH and HV are cross-polarized, transmitting in one orientation and receiving in the other. Co-polarized channels (VV, HH) are sensitive to surface tilt and large-scale roughness. Cross-polarized channels (VH, HV) primarily detect volume scattering and depolarization caused by complex geometry inside the scattering medium.
A flat rough surface usually returns stronger co-pol than cross-pol. A forest or shrubland with many randomly oriented branches depolarizes the wave and produces relatively strong cross-pol returns. By comparing VV and VH intensities, you can separate surface roughness (high VV, low VH) from volume scattering (high VV and high VH). Polarization doesn’t change the fundamental roughness of the target. But it filters which scattering mechanisms dominate the observed brightness.
Real-World Examples of Roughness-Driven Backscatter Variations
Agricultural fields demonstrate roughness-driven brightness changes clearly. A freshly plowed field with furrows parallel to the radar look direction scatters radar energy back strongly because the ridges and troughs create wavelength-scale roughness and present tilted facets that redirect energy toward the sensor. The field appears bright. After rain compacts the soil and smooths the surface, or after a farmer uses a roller to level the field, the same area darkens. The reduced roughness allows more specular reflection. If the field is then planted and crop seedlings emerge, brightness may increase again as the small plants introduce volume scattering.
Comparing two SAR images separated by a few weeks can reveal tillage events, planting dates, and crop growth purely from backscatter intensity shifts tied to changing surface and canopy roughness.
Urban surfaces produce some of the brightest backscatter values in any SAR scene, but the mechanism is geometric rather than simple roughness. Buildings create corner reflectors where the vertical wall meets the horizontal ground. The radar pulse hits the ground, bounces up to the wall, and reflects directly back to the sensor in a double-bounce path. This returns far more energy than diffuse scattering from a rough natural surface. Roads and parking lots, when dry and smooth, appear dark because they reflect energy away. Wet pavement can brighten slightly due to the thin water film increasing dielectric contrast and slight surface ripples. But the brightness rarely matches the extreme returns from building corners.
In a SAR image, cities show as clusters of very bright pixels surrounded by moderate-brightness residential areas and dark linear features where streets align to reflect away from the sensor.
Ocean surfaces shift brightness with wind speed and sea state. Calm water is smooth at radar wavelengths and appears uniformly dark. As wind increases, small waves and ripples form, introducing wavelength-scale roughness that scatters radar diffusely. Brightness increases. At moderate wind speeds the ocean surface is covered in centimeter-scale ripples visible to X-band and C-band radar, producing a mottled gray texture. Strong winds generate larger waves, but very long swells (wavelengths of tens of meters) can appear smooth to radar because their slopes are gentle over the scale of a radar resolution cell.
Oil slicks on the ocean dampen short surface waves and smooth the local sea surface. The oil-covered patch appears as a dark area against the brighter rough background. That’s a signature used for pollution monitoring. The brightness difference is entirely due to roughness suppression by the oil film, not a direct detection of the oil itself.
Rocky terrain versus fine sediment illustrates how natural surface texture controls backscatter. A boulder field or rough lava flow presents many wavelength-scale facets and edges. The rocks scatter radar energy in all directions, and enough returns to the sensor to create bright pixels. The spatial pattern often looks grainy or mottled because individual boulders or rock clusters produce isolated bright spots. A dry lakebed or sandy desert with fine, wind-smoothed sand is much smoother at radar wavelengths. The surface approaches the specular limit, reflecting most energy away and appearing dark or very low in backscatter.
If you walk across that lakebed and disturb the crust, breaking it into rough clumps, SAR acquired afterward will show brighter returns in the disturbed area. Geologists use these brightness contrasts to map surface geology, distinguishing rough volcanic deposits from smooth sedimentary plains without visiting the site.
Practical Guidelines for Interpreting SAR Brightness

Interpreting SAR backscatter in terms of surface roughness requires a systematic approach that accounts for sensor parameters, scattering physics, and ground context. Here’s how to build reliable interpretations:
Check sensor wavelength and calculate the roughness threshold. Find the radar band (X, C, L) and wavelength. Surfaces with height variations much smaller than one-tenth the wavelength will behave as smooth (specular, dark). Surfaces with variations near or above the wavelength will scatter diffusely (brighter). For example, 3 cm X-band treats 2 mm texture as smooth, but 23 cm L-band doesn’t respond to that same texture at all.
Identify the incidence angle and assess slope effects. Steeper incidence angles (closer to perpendicular) increase backscatter from rough surfaces. Shallow grazing angles reduce total return power. If terrain slopes toward the radar, local incidence decreases and brightness increases even if roughness stays constant. Check whether bright patches correlate with topography before attributing them to surface roughness alone.
Compare co-polarized and cross-polarized channels if available. High VV or HH with low VH suggests surface or double-bounce scattering driven by roughness and geometry. High VH relative to VV indicates volume scattering or depolarization, common in vegetation and complex structures. Polarization helps separate roughness scattering from other mechanisms that also produce bright pixels.
Look for spatial patterns and contextual clues. Uniform brightness over large areas usually indicates consistent surface type (smooth lakebed, rough grassland). Sharp brightness boundaries often mark surface discontinuities like a road edge, field boundary, or water line. Very bright isolated points in otherwise moderate areas are likely corner reflectors (buildings, metal structures) rather than extreme roughness. Use the spatial distribution to infer whether brightness variations come from roughness changes or geometric artifacts.
Cross-reference with optical imagery or ground knowledge when possible. Optical images reveal color, texture, and land cover that SAR can’t directly measure. A bright SAR patch over known forest is likely volume scattering, not surface roughness. A dark patch over a known paved runway confirms specular reflection. Ground truth or previous field surveys anchor your roughness interpretations to reality and reduce ambiguity.
Account for moisture and temporal changes. Wet surfaces have higher dielectric constants and can return stronger backscatter even if roughness doesn’t change. Compare pre-rain and post-rain SAR images to separate moisture effects from roughness. If brightness increases after rainfall but the surface wasn’t tilled or disturbed, the change is probably moisture rather than roughness. A brightness drop in an agricultural field between two dry-season images likely indicates smoothing by farm equipment or crop harvest, not drying.
Final Words
We tied SAR backscatter to surface roughness right away: rough textures scatter radar and appear bright, smooth surfaces reflect energy away and look dark. We also ran through how incidence angle, wavelength, and polarization change that picture.
You got concrete examples and a simple six-step way to read brightness patterns against sensor settings and terrain scale.
Keep practicing with real scenes — interpreting SAR backscatter: what radar brightness reveals about surface roughness becomes clearer with each image you study. You’ll get more confident fast.
FAQ
Q: What is SAR backscatter and why does it matter?
A: SAR backscatter is the radar energy returned to the sensor from a surface. It matters because brightness reveals surface shape, roughness, and material differences useful for mapping and change detection.
Q: How does surface roughness change SAR brightness?
A: Surface roughness changes SAR brightness by shifting between diffuse scattering (rough, bright) and specular reflection (smooth, dark). Rough surfaces scatter energy broadly; smooth surfaces send energy away from the sensor.
Q: What does “roughness relative to radar wavelength” mean and how does it alter brightness?
A: Roughness relative to wavelength means surface bumps compared to the radar’s wavelength. When bumps are similar or larger than the wavelength, scattering and brightness increase; much smaller bumps give weaker returns.
Q: How does incidence angle influence backscatter?
A: Incidence angle influences return strength: more vertical viewing (lower incidence) often gives stronger returns from rough surfaces, while grazing (higher incidence) can weaken returns or favor specular reflections depending on slope.
Q: How does radar wavelength change the backscatter response?
A: Radar wavelength changes penetration and sensitivity: longer wavelengths (L-band) probe deeper and respond to larger roughness, while shorter wavelengths (X‑band) sense fine surface texture and the top skin roughness.
Q: How does SAR polarization affect sensitivity to roughness and materials?
A: SAR polarization changes what scattering you see: same-pol (VV, HH) highlights surface and double‑bounce geometry, while cross-pol (VH, HV) emphasizes volume scattering from rough vegetation or complex structures.
Q: What real-world examples show roughness-driven backscatter differences?
A: Real-world examples include plowed vs smooth fields (plowed bright), urban corners and buildings (very bright), wind‑roughened seas (brightness rises), rocky outcrops (bright) and fine sediments (dark).
Q: How can I tell roughness effects apart from dielectric or vegetation signals in SAR images?
A: You can tell roughness by comparing polarizations, wavelengths, time series, and optical context. Roughness gives geometry-driven, often consistent signatures; moisture changes dielectric and vegetation shows strong cross‑pol and seasonal shifts.
Q: What practical steps should analysts follow to interpret SAR brightness for roughness?
A: Analysts should follow six steps: 1) note sensor angle, wavelength, polarization; 2) compare polarizations; 3) assess brightness patterns; 4) check wavelength sensitivity; 5) consult optical/context maps; 6) validate with field or time series.