
What if you could read a planet’s air like a barcode as it slips across its star?
That’s what JWST does, watching starlight filtered through a thin atmosphere and noting which infrared colors disappear.
Those missing colors are molecular fingerprints, like water, carbon dioxide and methane, each tied to specific infrared wavelengths.
By comparing spectra before, during and after transits or eclipses with instruments such as NIRSpec and MIRI, JWST pulls out tiny absorption and emission lines.
This post explains the physics and the practical steps scientists use to turn faint infrared dips into reliable molecule detections and rough abundances.
Core Process Behind JWST’s Molecular Measurements in Exoplanet Spectra
When a planet crosses in front of its star, starlight filters through the planet’s outer atmosphere before it gets to Earth. Molecules in that thin shell grab photons at specific wavelengths and leave dark fingerprints in the star’s spectrum. JWST records those fingerprints in the infrared, where most molecular vibrations and rotations appear. The observatory watches the star through the entire transit, comparing the spectrum taken when the planet blocks the star to baseline spectra captured before and after. The difference between those two measurements shows which wavelengths the atmosphere absorbed.
JWST’s 6.6 meter mirror collects about 45 times more light than Spitzer’s 0.85 meter mirror. The telescope sits at L2, roughly 1.5 million kilometers from Earth. The cold side of the observatory runs at about −233 °C, keeping thermal noise low so JWST can pick up faint infrared signals earlier observatories missed. Water, carbon dioxide, methane, and sulfur dioxide all have vibrational transitions in JWST’s wavelength range. Each molecule bends, stretches, or rotates at characteristic energies, and those energies match specific infrared wavelengths. JWST’s detectors are sensitive enough, and the mirror large enough, to catch absorption lines even when the atmospheric signal is tiny.
JWST also measures emission spectra during secondary eclipse, when the planet passes behind the star and the thermal glow from the planet’s day side gets briefly blocked. Subtract the star-only spectrum from the combined star-plus-planet spectrum and you isolate the planet’s own thermal emission. Hot atmospheres radiate strongly in the infrared, and molecules emit at the same wavelengths where they absorb. JWST captures that emission and uses it to measure temperatures, vertical structure, and molecular abundances in the planet’s atmosphere.
Key molecular features JWST can identify:
- Water vapor (H₂O): absorption bands near 1.4, 1.9, and 2.7 microns
- Carbon dioxide (CO₂): strong feature around 4.3 microns in the mid infrared
- Methane (CH₄): absorption bands at 2.3, 3.3, and 7.7 microns
- Sulfur dioxide (SO₂): features around 7.3 and 8.7 microns
- Carbon monoxide (CO): vibrational band near 4.6 microns
JWST Infrared Coverage and Its Role in Detecting Atmospheric Molecules
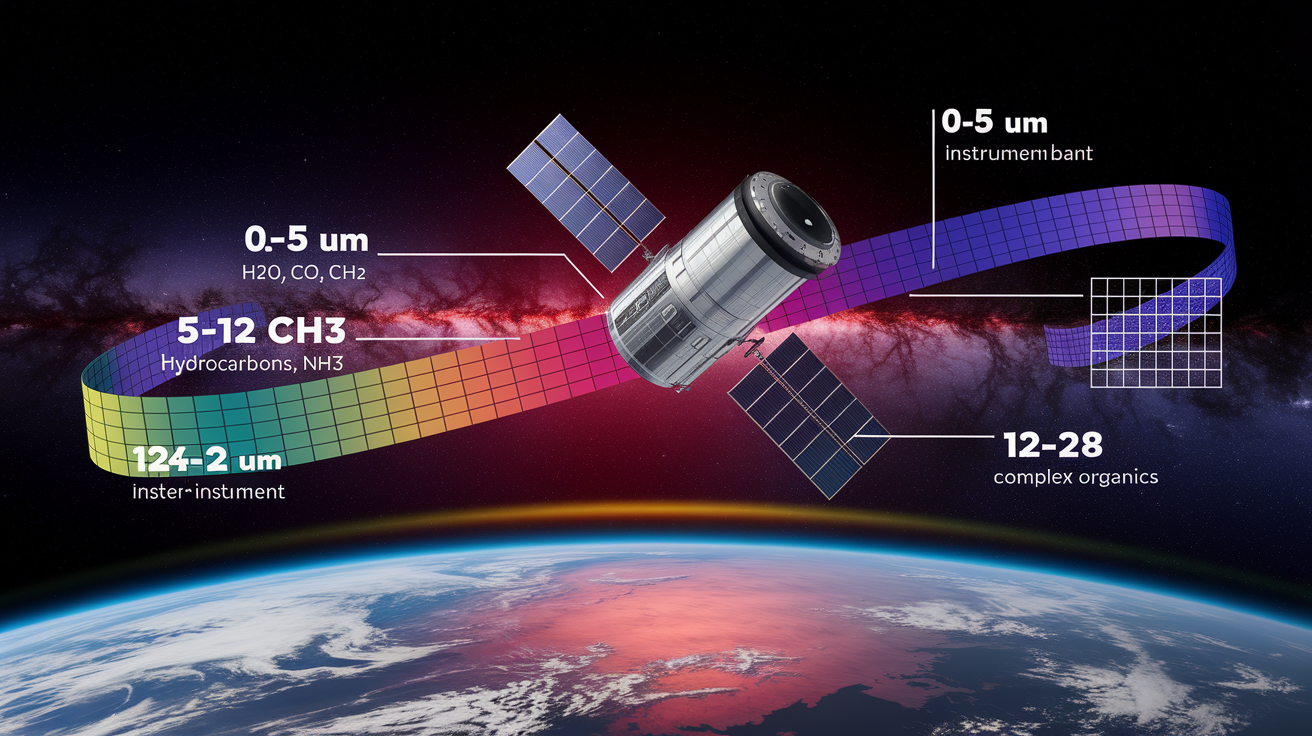
Molecules absorb and emit light when their bonds vibrate or rotate. Those transitions need specific amounts of energy, and for most common atmospheric molecules the energy levels correspond to infrared wavelengths. JWST covers wavelengths from about 0.6 to 28 microns, spanning near infrared through mid infrared. Water, carbon dioxide, methane, and carbon monoxide all have strong vibrational bands in that range. Shorter wavelengths reveal electronic and near infrared overtone bands. Longer mid infrared wavelengths capture fundamental vibrational modes, which are often stronger and easier to detect. JWST’s infrared focus works because visible light spectroscopy misses most of these fingerprints, and ground-based infrared observatories struggle with Earth’s own atmospheric absorption.
MIRI, JWST’s Mid InfraRed Instrument, extends coverage from 5 to 28 microns and delivers 100 to 1000 times better sensitivity than previous infrared facilities for solid state ice spectroscopy. That sensitivity lets JWST detect not only gas phase molecules in hot exoplanet atmospheres but also ices and organic compounds in cooler environments like protoplanetary disks. Mid infrared spectra reveal carbon dioxide, hydrocarbons such as acetylene and benzene, and complex organics that were invisible to earlier observatories. The combination of wavelength range and sensitivity means JWST can measure molecular abundances, temperature profiles, and even isotopologue ratios, all from the same infrared spectrum.
| Wavelength Range (microns) | Molecules Best Detected |
|---|---|
| 0.6–5 | H₂O, CO, CH₄, CO₂ (near IR bands) |
| 5–12 | CO₂, CH₄, NH₃, hydrocarbons, silicates |
| 12–28 | Complex organics, ices, crystalline silicates |
| Full range (0.6–28) | Isotopologues, trace species, thermal continuum |
Instruments JWST Uses to Measure Molecules in Exoplanet Spectra
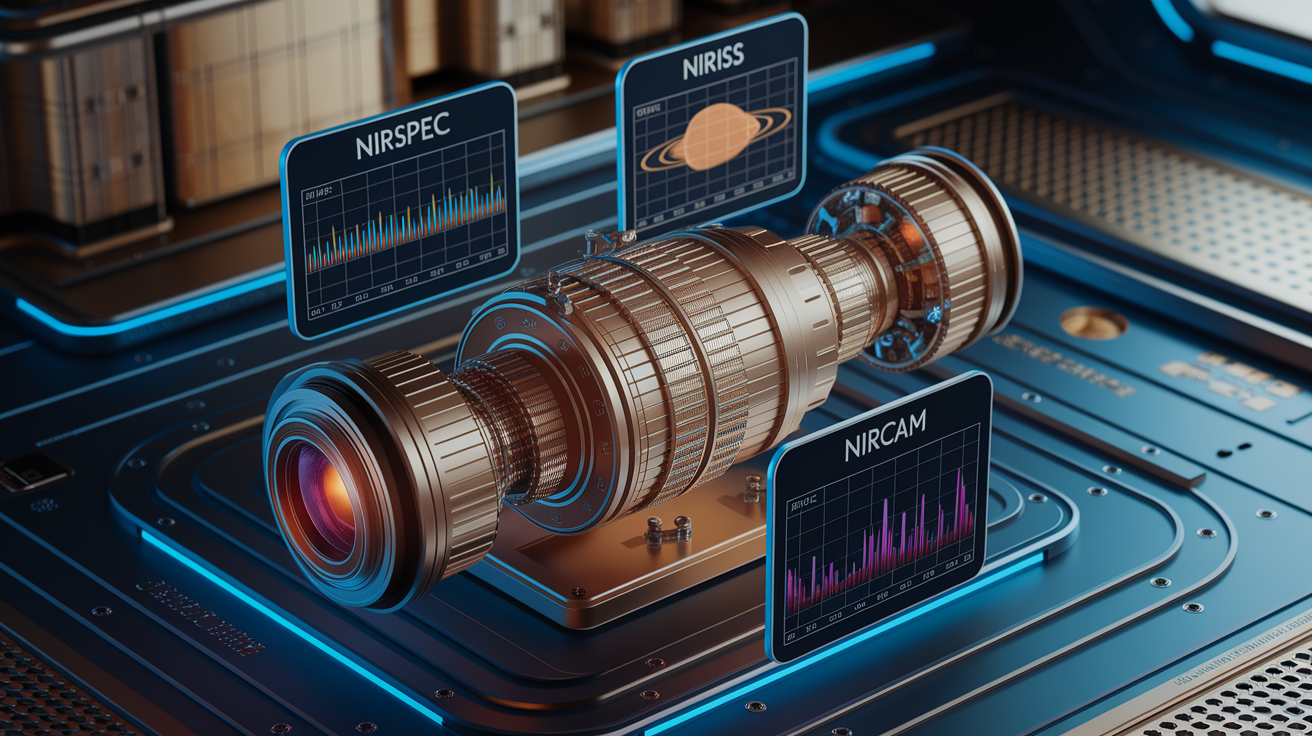
NIRSpec, the Near Infrared Spectrograph, offers low, medium, and high spectral resolution modes. Low resolution spreads light across fewer detector pixels and works well for broad molecular bands. Medium and high resolution sharpen absorption lines, letting observers separate closely spaced features that would otherwise blend together. NIRSpec’s resolution matters because overlapping lines from different molecules can confuse abundance estimates. Resolving individual lines helps confirm which molecules are present and rules out false positives caused by blended features.
NIRISS, the Near Infrared Imager and Slitless Spectrograph, provides time series spectroscopy during transit events. NIRISS records an entire spectrum for every exposure. Observers take hundreds or thousands of spectra as the planet crosses the star. The instrument’s slitless mode captures all the light without spatial masking, which boosts signal and simplifies data reduction. NIRISS has been used to measure water vapor and other species in hot Jupiter and sub Neptune atmospheres, and its stability makes it well suited for detecting tiny changes in transit depth across wavelength.
NIRCam, the Near Infrared Camera, contributes grism spectroscopy alongside its imaging capabilities. Grisms disperse light across the detector, producing low resolution spectra that cover broad wavelength ranges in a single exposure. NIRCam grisms are useful for measuring continuum slopes and detecting wide molecular bands without the complexity of a dedicated spectrograph. The instrument complements NIRSpec and NIRISS by providing photometric context and independent spectral measurements.
MIRI’s Mid Infrared Strength
MIRI detects molecules that emit or absorb in the 5 to 28 micron range, including carbon dioxide around 4.3 microns, methane bands near 7.7 microns, and hydrocarbons such as acetylene and benzene. MIRI’s sensitivity allows detection of complex organics and ices that are invisible at shorter wavelengths. The instrument also resolves isotopologue features, such as the rarer heavy carbon version of CO₂, which radiates from deeper, cooler layers than the main isotopologue. MIRI spectra reveal mid plane temperatures around 200 K and surface layers near 500 K, giving a vertical slice through disk or atmospheric structure. The instrument’s coverage makes it essential for studying carbon rich disks, temperate exoplanet atmospheres, and any environment where mid infrared molecular fingerprints dominate.
Spectral Signatures and Atmospheric Features JWST Identifies
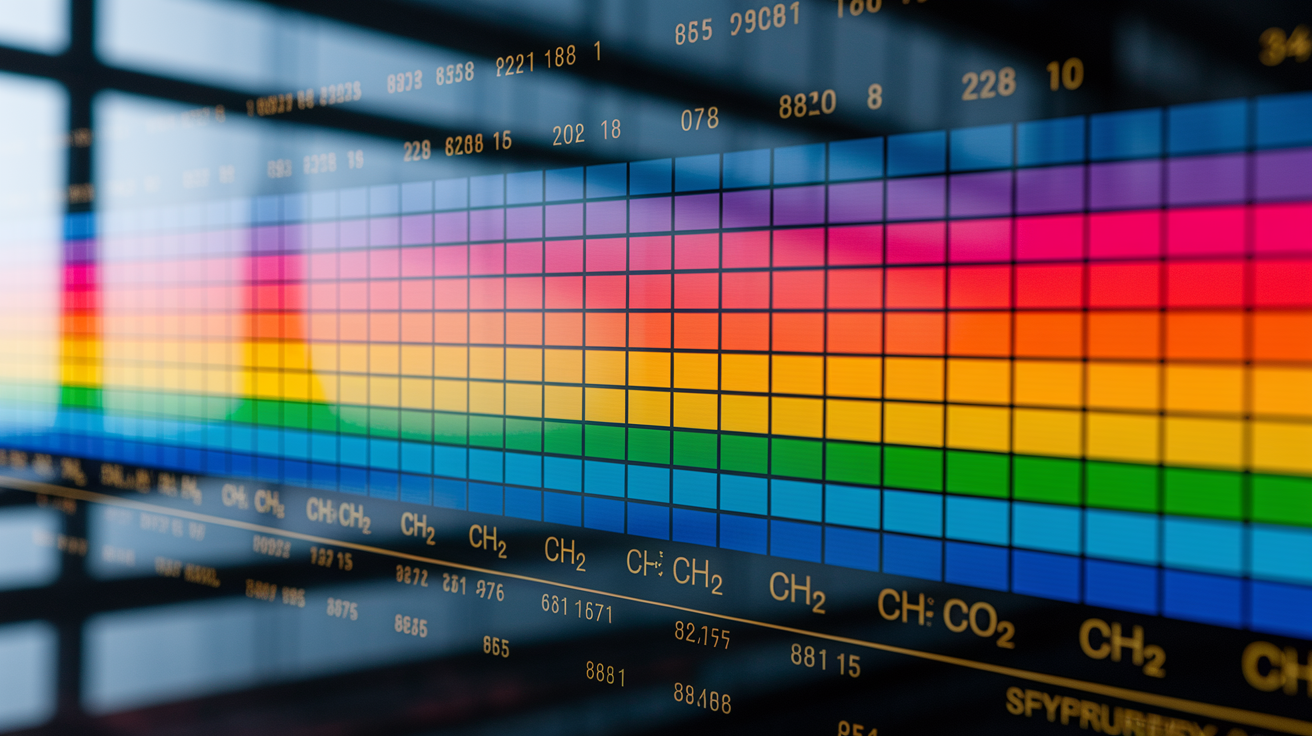
Molecules leave distinct patterns in spectra. Line position tells you which molecule it is, line width reveals temperature and pressure, and line depth indicates abundance. Laboratory measurements provide reference cross sections for each molecule, showing exactly which wavelengths it absorbs. JWST observers compare detected features to those cross sections, looking for matches. If multiple lines from the same molecule appear at the expected wavelengths and with consistent depths, the detection is confirmed. Temperature and pressure broaden or narrow the lines, so fitting the observed line shapes also constrains the physical conditions in the atmosphere.
Early JWST datasets show clear examples. WASP-39b’s spectrum revealed a prominent carbon dioxide absorption feature around 4.3 microns. TOI-421 b showed water vapor and tentative sulfur dioxide alongside dominant molecular hydrogen. K2-18 b’s spectrum indicated methane or carbon dioxide, along with a tentative signal from dimethyl sulfide, though that detection needs confirmation. Some sub Neptunes show flat, featureless spectra because hydrocarbon haze layers scatter and absorb across all wavelengths, hiding the molecular fingerprints underneath.
Six examples of spectral features and what they reveal:
- Sharp, deep absorption line at 4.26 microns. Carbon dioxide fundamental vibrational band. Indicates CO₂ abundance and atmospheric temperature.
- Broad absorption band near 2.7 microns. Water vapor stretching mode. Sensitive to H₂O mixing ratio and vertical distribution.
- Methane feature at 3.3 microns. CH₄ C–H stretch. Reveals carbon to oxygen ratio and disequilibrium chemistry.
- Flat continuum across multiple wavelengths. High altitude haze or cloud deck. Masks underlying molecular features.
- Sulfur dioxide absorption around 7.3 microns. Photochemistry signature, often linked to stellar UV input.
- Isotopologue line offset by a few hundredths of a micron. Probes deeper atmospheric layers and isotopic composition. Helps measure temperature gradients.
Data Processing Steps JWST Uses to Extract Molecular Signals

Raw detector images contain bias levels, dark current, and pixel to pixel sensitivity variations that must be corrected before spectral extraction. The pipeline subtracts a bias frame taken with zero exposure time, removes dark current measured during calibration exposures, and divides by a flat field image that normalizes pixel response. After those corrections, the data represent photon counts from the sky, but they still include scattered light, detector artifacts, and wavelength dependent throughput variations. Each step sharpens the signal and reduces systematic noise.
Spectral extraction maps detector pixels to wavelength and flux. The pipeline identifies which pixels belong to each spectral order, sums the counts along the dispersion direction, and subtracts background light from nearby detector regions. Wavelength calibration uses known spectral lines from calibration lamps or telluric features to assign a precise wavelength to each pixel. After extraction, the spectrum is a one dimensional array of flux versus wavelength, ready for light curve analysis. Observers bin the data into wavelength channels and measure the transit depth in each channel, producing a transmission or emission spectrum.
Light curve fitting isolates the molecular signal by modeling instrumental systematics and astrophysical effects. JWST data include trends caused by telescope pointing drift, detector temperature changes, and mirror segment alignment shifts. These trends can mimic or hide real atmospheric features, so the pipeline fits a baseline model that includes stellar limb darkening, orbital parameters, and systematic polynomials or Gaussian processes. Subtracting the best fit model leaves a residual light curve that shows only the wavelength dependent transit depth. That residual is the atmospheric signal, and it reveals which molecules absorbed starlight during the transit.
Atmospheric Retrieval: How JWST Converts Spectra Into Molecular Abundances

Atmospheric retrieval runs forward models that simulate a spectrum based on assumed chemistry, temperature, pressure, and cloud properties. Each model starts with a vertical profile of temperature and pressure, assigns molecular mixing ratios at each layer, and computes how much light each molecule absorbs or emits. The model uses line lists and cross sections from laboratory databases to calculate opacity at thousands of wavelengths, then integrates along the line of sight through the atmosphere. The result is a synthetic spectrum that can be compared to JWST observations. Adjust the input parameters and rerun the model, and retrieval codes search for the combination that best matches the data.
Bayesian retrieval frameworks quantify uncertainty and test multiple scenarios. The algorithm samples millions of parameter combinations, calculating the likelihood that each one reproduces the observed spectrum. Priors on temperature, abundance, and cloud properties guide the search, and the output is a probability distribution for each parameter. High confidence detections show narrow peaks in the posterior distribution, meaning the data strongly favor a particular abundance. Marginal or tentative detections show broad, overlapping distributions, and retrieval codes report upper limits or ambiguous ranges. This approach distinguishes real molecular signals from noise and confirms whether a feature is statistically significant.
The Role of Molecular Databases
Line lists catalog every known absorption or emission transition for a given molecule, including position, strength, and pressure broadening coefficients. Cross sections tabulate opacity as a function of wavelength, temperature, and pressure. JWST retrieval codes rely on databases such as HITRAN, ExoMol, and HITEMP to compute accurate opacities across the observatory’s wavelength range. Without precise line data, a model might miss weak features or misidentify blended lines. Ongoing laboratory and theoretical work continues to refine these databases, especially for molecules such as methane, water, and complex organics. That work improves the accuracy of JWST abundance measurements and helps observers detect new species in exoplanet atmospheres.
Challenges JWST Faces When Measuring Exoplanet Molecules
Clouds and haze scatter and absorb light across a wide wavelength range, flattening the spectrum and hiding molecular features underneath. Hydrocarbon hazes, common in cooler sub Neptunes, produce featureless spectra even when molecules are present. High altitude aerosols block the deeper atmospheric layers where most of the molecular absorption happens, so JWST sees only the top of the haze deck. Observers try to work around this by targeting hotter planets, where haze particles evaporate, or by using longer wavelengths where some haze becomes transparent.
M dwarf host stars introduce stellar spot contamination. Active stars have dark spots and bright faculae that rotate in and out of view during a transit. When a planet crosses a spot, the observed spectrum includes less light from the cool, spot covered region and relatively more from the hotter photosphere. That imbalance mimics or distorts molecular features, leading to false detections or incorrect abundance estimates. JWST observers model stellar activity by monitoring the star over multiple rotations and by fitting spot parameters alongside atmospheric retrieval, but disentangling stellar and planetary signals remains difficult for the most active hosts.
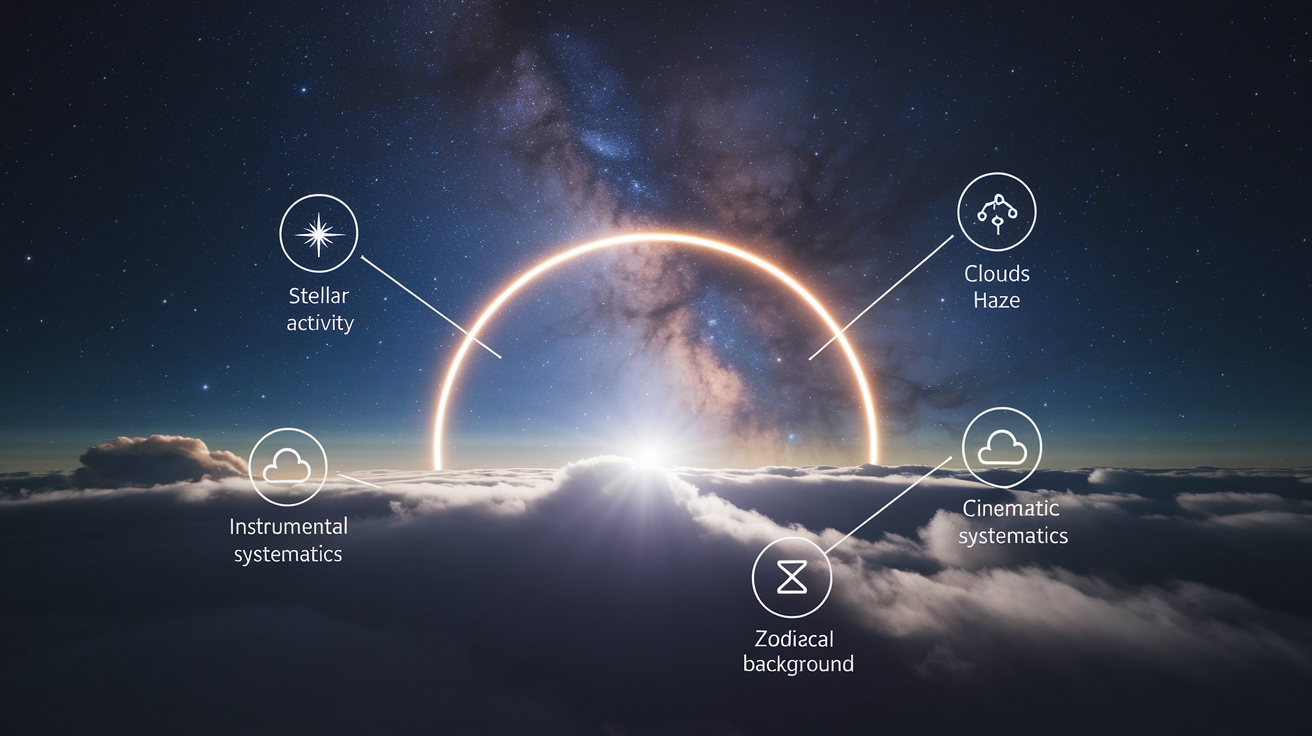
Four main sources of noise and contamination:
- Stellar activity. Spots, faculae, and flares alter the baseline spectrum and introduce wavelength dependent signals.
- High altitude clouds and haze. Scatter and absorb light, muting molecular absorption lines.
- Instrumental systematics. Detector drift, pointing jitter, and thermal variations create correlated noise.
- Telluric and zodiacal background. Residual Earth atmosphere emission (for some wavelengths) and scattered sunlight add noise, though JWST’s L2 orbit minimizes this.
Real Case Studies Showing How JWST Measures Molecules
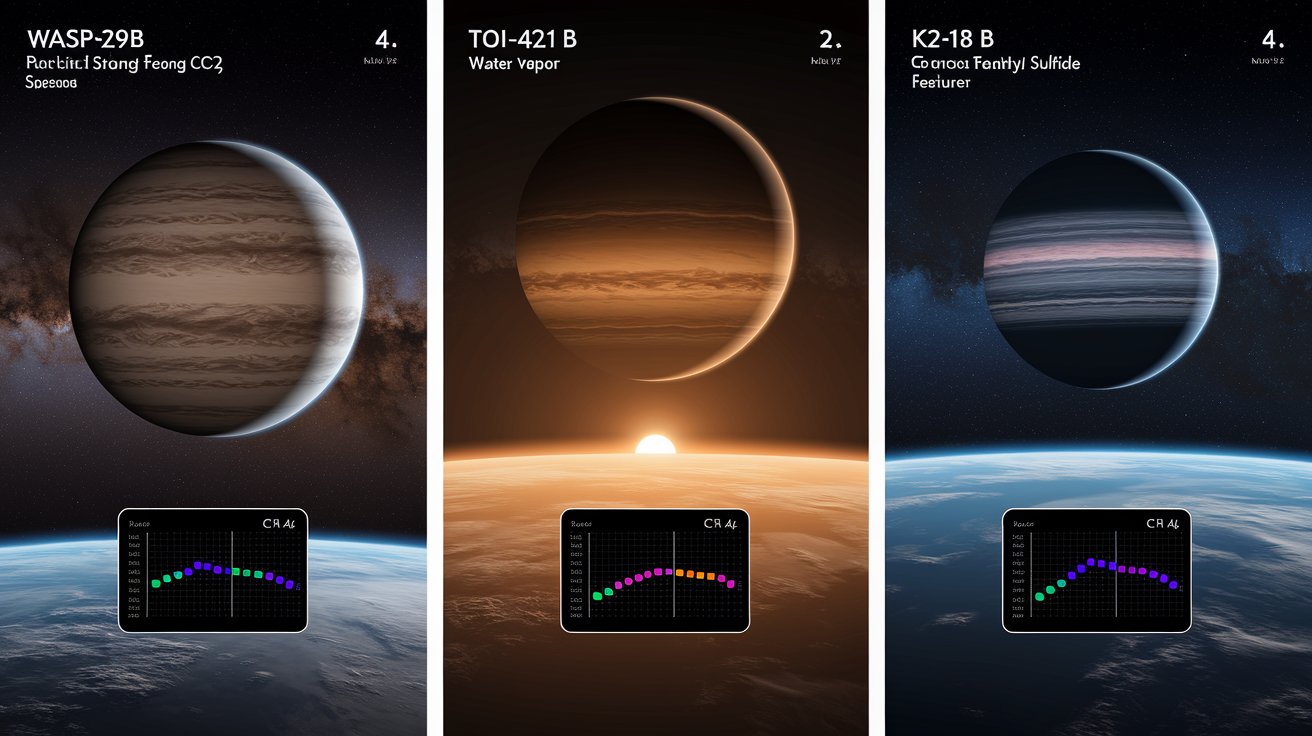
WASP-39b, a hot Jupiter, produced one of the first clear exoplanet detections of carbon dioxide. JWST observed the planet during primary transit and recorded a prominent absorption feature around 4.3 microns. The depth and shape of the feature matched laboratory CO₂ cross sections, and retrieval models confirmed the molecule’s presence with high confidence. The detection showed JWST’s sensitivity to mid infrared molecular bands and validated the transmission spectroscopy pipeline. WASP-39b’s spectrum also showed water vapor, giving observers a multi molecule abundance measurement from a single transit.
TOI-421 b, a hot sub Neptune, revealed a hydrogen rich atmosphere with clear water vapor and tentative signatures of carbon monoxide and sulfur dioxide. JWST’s NIRSpec instrument recorded the transit in medium resolution, separating overlapping molecular features that earlier observatories couldn’t resolve. The spectrum showed no methane or carbon dioxide, suggesting a high atmospheric temperature or disequilibrium chemistry that favors CO over methane. The sulfur dioxide detection, if confirmed, points to photochemical processes driven by the host star’s ultraviolet radiation.
K2-18 b, a cooler sub Neptune sometimes called a candidate Hycean world, showed dominant carbon dioxide or methane in its spectrum, along with a tentative detection of dimethyl sulfide. Dimethyl sulfide is a potential biosignature, but the signal is weak and needs additional observations to confirm. The planet’s spectrum also suggests the possibility of a hydrogen rich envelope overlying a liquid water ocean, though that interpretation is still debated. JWST’s ability to detect complex molecules in temperate atmospheres opens the door to biosignature searches, but distinguishing real signals from noise and contamination will take many high precision transits.
| Planet | Molecules Detected | Method |
|---|---|---|
| WASP-39b | CO₂, H₂O | Transmission spectroscopy (NIRSpec, MIRI) |
| TOI-421 b | H₂O, tentative CO, tentative SO₂ | Transmission spectroscopy (NIRSpec) |
| K2-18 b | CO₂ or CH₄, tentative dimethyl sulfide | Transmission spectroscopy (NIRSpec) |
Final Words
During a transit, starlight filters through a planet’s air and leaves clear absorption fingerprints; JWST’s infrared instruments catch those lines and use secondary-eclipse emission to add thermal clues.
We ran through detector corrections, spectral extraction, and atmospheric retrievals that turn faint lines into molecule amounts. Clouds, stellar activity, and systematics can blur the signal, but careful calibration and case studies like WASP‑39b show the approach works.
Overall, you can see how JWST measures molecules in exoplanet spectra; it’s making atmospheres far more readable and pointing toward more discoveries.
FAQ
Q: What is the core process behind JWST’s molecular measurements in exoplanet spectra?
A: The core process behind JWST’s molecular measurements in exoplanet spectra is starlight passing through or emitted by a planet’s atmosphere, creating absorption or emission fingerprints that JWST’s infrared instruments record at high signal-to-noise.
Q: How does JWST use transmission and emission spectroscopy to detect molecules?
A: JWST uses transmission spectroscopy when starlight filters through an atmosphere during transit, and emission spectroscopy during secondary eclipse when the planet’s thermal light reveals molecular features.
Q: Why are infrared wavelengths essential for detecting molecules with JWST?
A: Infrared wavelengths are essential because molecular vibrational and rotational transitions absorb there; JWST’s NIR instruments and MIRI cover about 0.6–28 microns, where many molecules leave clear fingerprints.
Q: Which JWST instruments measure molecules and what does each do?
A: NIRSpec gives low-to-high spectral resolution to isolate lines, NIRISS does slitless time-series for transits, NIRCam adds grism photometry, and MIRI covers mid-IR molecular fingerprints from 5–28 microns.
Q: Which molecules can JWST identify in exoplanet atmospheres?
A: JWST can identify water (H2O), carbon dioxide (CO2), methane (CH4), sulfur dioxide (SO2), carbon monoxide (CO), plus ices and organics in the mid‑IR depending on abundance and noise.
Q: How does JWST process raw detector data into usable spectra?
A: JWST processes raw data with detector corrections (bias, dark, flat), spectral extraction, background subtraction, wavelength calibration, and light‑curve fitting to remove systematics and isolate tiny transit-depth signals.
Q: How are molecular abundances extracted from JWST spectra?
A: Molecular abundances are extracted by fitting radiative-transfer models to spectra using line lists and Bayesian retrievals, which estimate composition, temperature profiles, and detection confidence.
Q: What challenges limit JWST when measuring exoplanet molecules?
A: Main challenges are clouds and haze that mute features, stellar activity that contaminates signals, instrument systematics, and low signal for small or cool planets; repeated observations help.
Q: What early JWST detections show how the method works in practice?
A: Early JWST detections include CO2 in WASP‑39b, H2O and SO2 in TOI‑421b, and methane-related hints in K2‑18b, showing both transmission and emission techniques can reveal real molecules.
Q: How do molecular databases help validate JWST detections?
A: Molecular databases provide laboratory line lists and cross-sections that match observed spectral features, letting scientists confirm species and rule out false positives.