
Can we tell what’s in a distant planet’s air by staring at its star?
Yes, infrared spectroscopy (splitting starlight into wavelengths) does that by showing which colors are missing when molecules absorb them.
During a transit, a thin slice of starlight filters through the planet’s atmosphere and picks up molecular fingerprints like water, methane, and carbon dioxide.
This piece explains how the filtering works, why infrared light is key, and how telescopes such as JWST turn faint dips in the spectrum into real chemical stories about alien skies.
Foundations of Infrared Spectroscopy in Exoplanet Studies

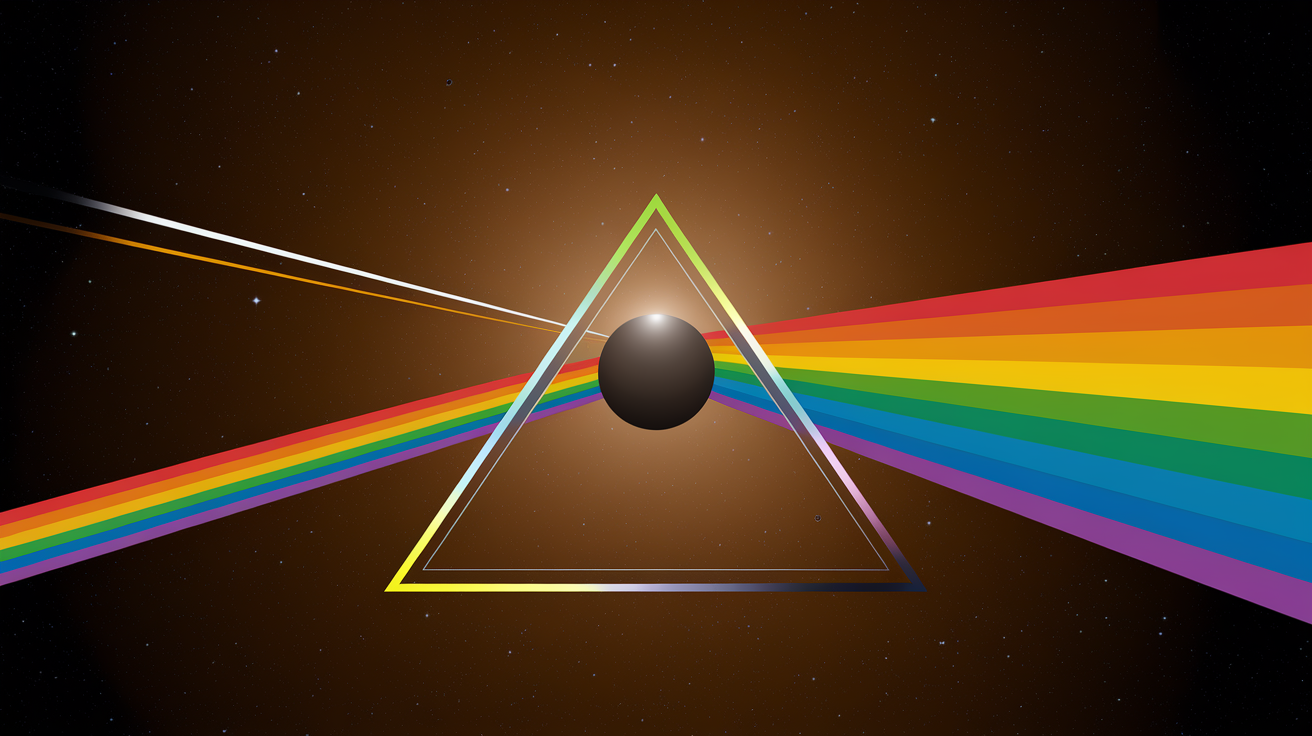
Infrared spectroscopy splits incoming starlight into its component wavelengths, letting scientists measure which wavelengths get absorbed by gases in a planet’s atmosphere. It’s basically a barcode scanner for molecules. Each gas has its own pattern of absorption across the infrared portion of the electromagnetic spectrum, roughly 0.7 to 28 microns in wavelength. When a planet crosses in front of its star during a transit, some of the star’s light passes through the thin shell of the planet’s atmosphere before reaching our telescopes. Molecules in that atmosphere absorb specific infrared wavelengths, leaving dark dips in what would otherwise be a continuous stellar spectrum.
Transit spectroscopy works by comparing two sets of observations: one taken while the planet is crossing the star’s disk, and another when the planet’s out of view. The difference between these two spectra isolates the light that traveled through the atmosphere. That filtered starlight carries the chemical fingerprint of whatever molecules were present along the path. Water vapor absorbs at certain wavelengths. Methane at others. Carbon dioxide at still others. By measuring the depth and shape of each absorption feature, scientists calculate how much of each gas is present and at what altitude it sits.
Data from instruments like JWST’s NIRSpec and MIRI arrive as plots of brightness versus wavelength. Scientists identify dips in those plots, match them to known molecular absorption bands from lab measurements, and run retrieval algorithms to infer mixing ratios, temperature profiles, and cloud coverage. The entire process relies on the fact that molecular vibrations and rotations happen at infrared energies, so infrared light is sensitive to the same molecules that define a planet’s chemistry and climate.
Infrared spectroscopy measures which wavelengths of light a planet’s atmosphere absorbs, revealing chemical composition. Transit observations compare starlight filtered through the atmosphere to unfiltered starlight, isolating the planetary signal. Absorption wavelengths correspond to specific molecular vibrations and rotations, creating unique fingerprints for water, methane, CO₂, and other gases. Extraction methods use spectral differencing and retrieval models to convert observed dips into abundance estimates and atmospheric structure.
How Infrared Light Interacts With Planetary Atmospheres

When infrared photons enter a planetary atmosphere, they encounter molecules that can absorb, emit, or scatter them depending on the photon’s energy and the molecule’s quantum states. Absorption happens when an infrared photon’s energy matches the gap between two vibrational or rotational energy levels in a molecule. For example, a water molecule can vibrate in several ways. Symmetric stretch, asymmetric stretch, bending. Each vibrational mode absorbs infrared light at a characteristic wavelength. Methane has four hydrogen atoms bonded to carbon, giving it a different set of vibrational modes and a different set of absorption bands. This is why the infrared spectrum of a methane-rich atmosphere looks different from one dominated by water vapor or carbon dioxide.
Temperature and pressure shape how those absorption features appear. Higher temperatures mean molecules move faster and occupy more rotational states, broadening spectral lines. Higher pressures increase collision rates, which also broaden lines through pressure broadening. Scattering by aerosols (tiny cloud or haze particles) can redirect infrared photons without absorbing them, flattening or muting the spectral features we expect to see. Thermal emission adds another layer. Warm atmospheres glow in the infrared, and the brightness at each wavelength depends on both temperature and the opacity of molecules at that wavelength. During a secondary eclipse, when the planet passes behind the star, we measure the combined light of star plus planet and then subtract the star alone to isolate the planet’s thermal emission spectrum.
Molecular vibration absorption: Infrared photons excite bending, stretching, and rotating motions in molecules, removing those wavelengths from the transmitted light. Thermal emission: Warm atmospheres emit infrared radiation. The spectrum depends on temperature and which gases are present to absorb or emit at each wavelength. Scattering effects: Cloud and haze particles scatter infrared photons, which can flatten absorption features and reduce the amplitude of spectral signals.
Detecting Molecular Signatures in Exoplanet Atmospheres
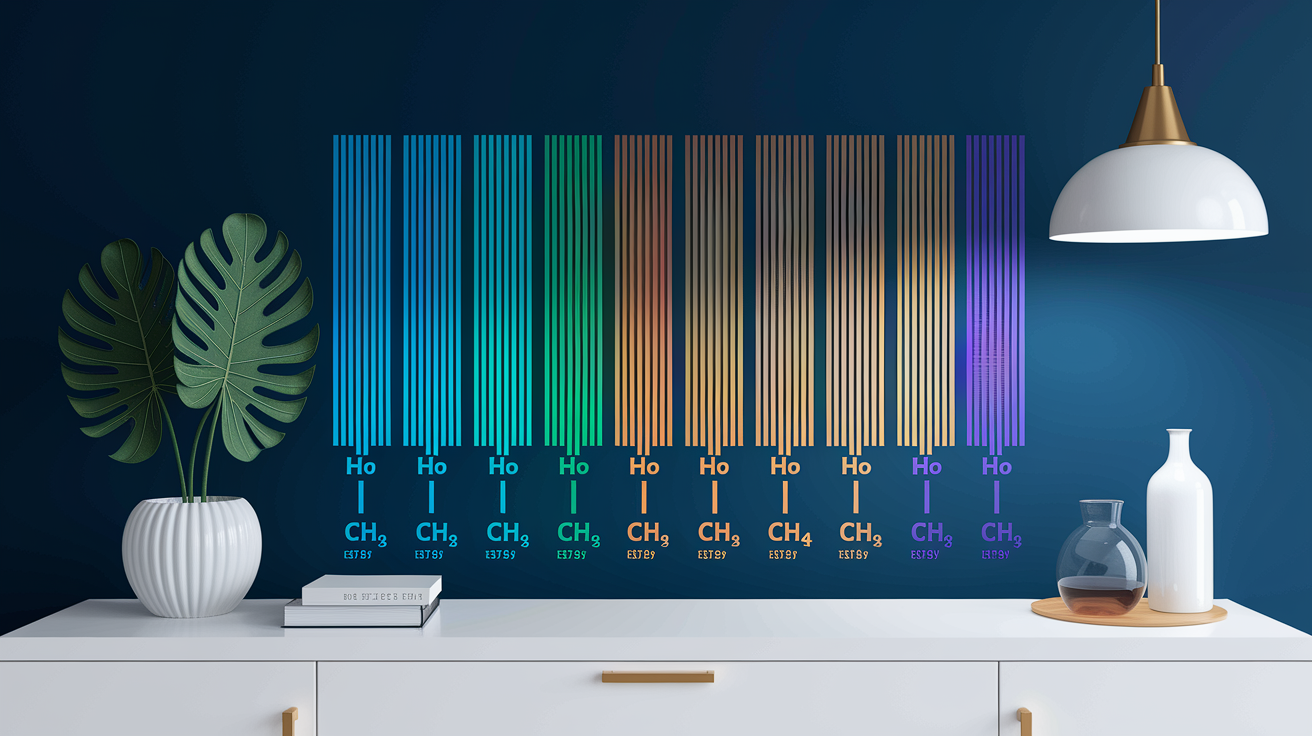
Identifying a molecule in an exoplanet atmosphere starts with matching observed absorption dips to lab-measured spectra. Water vapor produces strong absorption near 1.4 µm and again around 2.7 µm, along with broader features across the 0.9 to 3 µm range. Methane’s signature appears prominently near 3.3 µm, with additional bands at longer wavelengths. Carbon dioxide has a characteristic absorption centered at 4.3 µm. Carbon monoxide shows up near 4.6 µm. Each molecule leaves a distinct pattern, and the depth of each feature tells scientists how abundant that gas is along the line of sight through the atmosphere.
Scientists cross-reference observed spectra against databases of molecular cross-sections. These are tables that list how strongly each molecule absorbs at every wavelength. When a spectral dip aligns with a known molecular band and the shape matches the expected pressure and temperature broadening, that’s a detection. Abundance gets inferred by modeling how much of the molecule would be needed to produce the observed depth, accounting for atmospheric scale height, planet size, and stellar brightness. Overlapping bands can complicate interpretation, so analysts often fit multiple molecules simultaneously and use Bayesian retrieval codes to estimate the most probable mixing ratio for each gas.
The significance of each detection extends beyond simple presence or absence. Water vapor abundance constrains oxygen inventory and can indicate cloud condensation. Methane and carbon monoxide ratios reveal the balance between chemical equilibrium and photochemistry or vertical mixing. Carbon dioxide detections help map carbon budget and atmospheric metallicity. Together, these molecular signatures build a picture of atmospheric chemistry, temperature structure, and even hints about a planet’s formation history.
| Molecule | Key Infrared Wavelength (µm) | Detection Significance |
|---|---|---|
| Water vapor (H₂O) | 1.4, 2.7, 6.3 | Oxygen inventory, cloud formation, habitability proxy |
| Methane (CH₄) | 3.3, 7.7 | Carbon chemistry, disequilibrium processes, biological potential |
| Carbon dioxide (CO₂) | 4.3, 15 | Carbon budget, atmospheric metallicity, volcanic outgassing |
| Carbon monoxide (CO) | 4.6 | C/O ratio, high-temperature chemistry, vertical mixing |
| Ammonia (NH₃) | 10.5 | Nitrogen inventory, cloud layers, reducing atmospheres |
| Ozone (O₃) | 9.6 | Photochemistry, potential biosignature in terrestrial atmospheres |
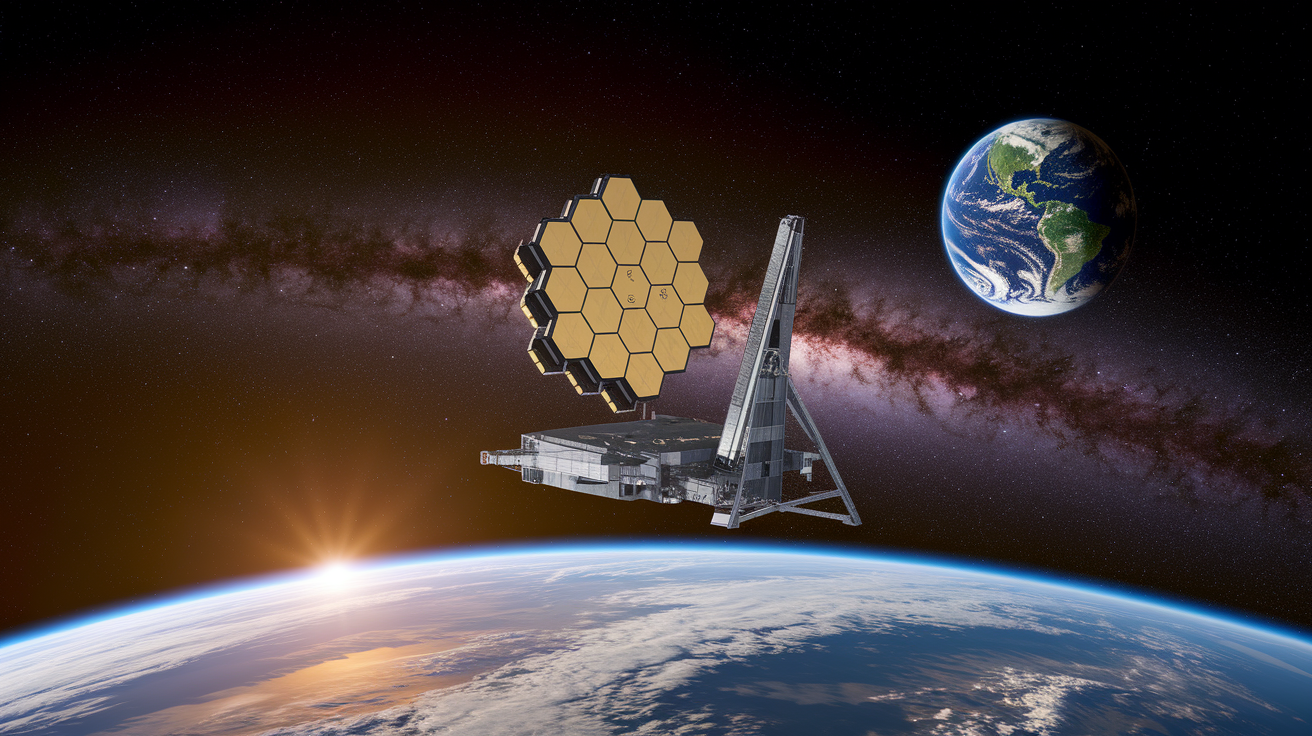
Breakthrough Observations from JWST
JWST launched on December 25, 2021. By mid-2022 it was delivering infrared spectra with signal-to-noise ratios that exceeded Hubble by factors of ten or more across key wavelength ranges. The NIRSpec instrument covers 0.6 to 5.3 µm with multiple resolution modes, while MIRI extends coverage from 5 to 28 µm, reaching into the mid-infrared where carbon dioxide, methane, and thermal emission features are strongest. Early results demonstrated JWST’s ability to detect molecular absorption in a single transit, something that previously required stacking dozens of observations. In July 2022, JWST released the transmission spectrum of WASP-96b, a hot gas giant, showing clear water-vapor absorption across 1.4 µm and beyond, along with evidence of clouds and haze.
Subsequent observations pushed into new territory. JWST detected carbon dioxide at 4.3 µm in the atmosphere of WASP-39b, marking the first unambiguous CO₂ detection in an exoplanet transmission spectrum. That same planet’s phase curve revealed day-night temperature contrasts and hints of photochemical haze. TRAPPIST-1, a system of seven roughly Earth-size planets orbiting an ultra-cool dwarf star, became a high-priority target. JWST observations tested for thick atmospheres on the innermost planets and began to constrain surface compositions and the presence or absence of significant volatiles. Cloud layers showed up as muted spectral features in several targets, forcing retrieval models to include cloud-top pressure and particle opacity as free parameters.
WASP-39b: JWST detected carbon dioxide, water vapor, and sulfur dioxide. Phase-curve observations revealed atmospheric circulation and possible photochemistry. TRAPPIST-1 planets: Early JWST data probed atmospheres on multiple rocky planets, setting limits on thick hydrogen envelopes and testing for secondary atmospheres. Cloud and haze evidence: Several hot Jupiters showed flattened or muted spectral features consistent with high-altitude aerosols, requiring updated cloud models in retrievals.
Data Interpretation Techniques in Infrared Exoplanet Research
Turning raw infrared spectra into atmospheric composition estimates requires a multi-step pipeline. First, detector data get calibrated to remove instrumental signatures. Dark current, flat-field variations, and pixel-to-pixel sensitivity differences. Wavelength calibration assigns each detector pixel to a precise wavelength using arc lamps or telluric absorption lines for ground-based data, and instrument reference files for space telescopes. Noise sources are identified and modeled: photon noise, read noise, and systematic drifts caused by telescope jitter or thermal variations.
Once calibrated, the light curve at each wavelength channel is extracted and detrended. For transmission spectroscopy, the transit depth is measured as a function of wavelength by fitting the light curve in narrow bins. For emission spectroscopy, the secondary-eclipse depth gives the planet-to-star flux ratio. Systematics (patterns in the data caused by the instrument or observing conditions rather than real astrophysical signal) get removed using techniques like common-mode correction or Gaussian processes. What remains is the transmission or emission spectrum, ready for retrieval.
Retrieval algorithms compare the observed spectrum to grids of forward models. Each forward model computes the expected spectrum for a given set of atmospheric parameters: temperature-pressure profile, molecular mixing ratios, cloud-top pressure, reference radius, and sometimes vertical mixing or photochemical rates. Bayesian inference, often via Markov Chain Monte Carlo (MCMC) or nested sampling, explores parameter space to find the set of values that best matches the data. The output is a set of posterior probability distributions, one for each parameter, that quantify both the best-fit value and the uncertainty. Degeneracies can appear when different combinations of parameters produce similar spectra. Breaking these requires high signal-to-noise, multi-wavelength coverage, or complementary data like phase curves or high-resolution spectroscopy.
Data calibration: Remove instrumental artifacts, apply flat-field and wavelength solutions, correct for detector nonlinearities. Noise reduction: Model and subtract systematic trends using detrending algorithms, isolate astrophysical signal from instrumental drifts. Spectral fitting: Extract transit or eclipse depth as a function of wavelength, constructing the transmission or emission spectrum. Compositional inference: Run retrieval models to estimate mixing ratios, temperature profiles, and cloud parameters, using Bayesian methods to quantify uncertainties.
Limitations and Challenges of Infrared Exoplanet Spectroscopy

Clouds and hazes are among the biggest obstacles. A high-altitude gray cloud can flatten molecular features almost completely, making a water-rich atmosphere look featureless. Retrievals then struggle to distinguish between low abundance and high cloud coverage. Stellar activity adds another layer of noise. Starspots and faculae introduce wavelength-dependent contamination that can mimic or mask planetary absorption features at the tens to hundreds of parts-per-million level. Monitoring the host star with contemporaneous photometry or spectroscopy helps, but correction methods are still evolving.
Instrument sensitivity limits what can be detected. Earth-size rocky planets around Sun-like stars produce transmission signals of only a few parts per million per scale height, near the floor of current precision even for JWST. Hundreds of transits might be required to reach robust detections unless the planet orbits a small, bright M-dwarf. Overlapping molecular absorption bands create degeneracies. Carbon monoxide and carbon dioxide both absorb in the 4 to 5 µm region, and disentangling their relative contributions requires careful modeling and high spectral resolution. Telluric absorption from Earth’s own atmosphere complicates ground-based infrared observations, though adaptive optics and space telescopes mitigate that issue.
Cloud cover: High-altitude aerosols mute absorption features, reducing detectability and introducing degeneracy between abundance and cloud-top pressure. Stellar contamination: Starspots and faculae imprint wavelength-dependent signals that can mimic or obscure planetary atmospheric features, requiring stellar monitoring and correction. Sensitivity floors: Small rocky planets produce weak signals, often below single-transit detection thresholds, necessitating stacked observations or next-generation facilities.
Future Developments in Exoplanet Atmospheric Analysis

Next-generation missions aim to push infrared spectroscopy beyond JWST’s capabilities. The Habitable Worlds Observatory, currently in the planning stages, is designed to directly image and spectroscopically characterize Earth-like planets in the habitable zones of nearby Sun-like stars. It will combine a large-aperture telescope with a starshade or coronagraph to suppress stellar light by factors of billions, enabling high-contrast imaging and spectroscopy of rocky worlds. ARIEL, the Atmospheric Remote-sensing Infrared Exoplanet Large-survey mission planned by the European Space Agency, will survey hundreds of exoplanets across 1.95 to 7.8 µm, building a statistical census of atmospheric compositions and linking them to planet mass, radius, and stellar type.
Ground-based extremely large telescopes (the Extremely Large Telescope, the Thirty Meter Telescope, and the Giant Magellan Telescope) will deploy high-resolution infrared spectrographs with resolving powers above 50,000. These instruments will resolve individual molecular lines, enabling cross-correlation techniques that can detect faint signals buried in noise and measure atmospheric dynamics through Doppler shifts. Combining space-based broad-wavelength coverage with ground-based high-resolution line spectroscopy will break degeneracies, constrain vertical mixing, and detect trace species that are invisible at lower resolution.
Habitable Worlds Observatory: Planned large-aperture space telescope with starshade or coronagraph, targeting direct imaging and spectroscopy of Earth-size planets in habitable zones. ARIEL mission: ESA survey mission covering 1.95 to 7.8 µm, aiming to characterize hundreds of exoplanet atmospheres and build a comparative database of compositions. Extremely large telescopes: Ground-based 30 to 40 meter telescopes with high-resolution infrared spectrographs, enabling Doppler measurements, line-by-line molecular detection, and atmospheric dynamics studies.
Final Words
Tracing how infrared spectroscopy reveals exoplanet atmospheres, we followed the chain: what the method measures, how transit observations capture infrared dips, and how those dips match molecular fingerprints.
We touched on the physics (vibration, emission, scattering), key molecules like water, methane, and carbon dioxide, JWST’s role, and the retrieval steps scientists use to pull composition from noisy light.
If you take one clear idea away, it’s this: how infrared spectroscopy reveals exoplanet atmospheres, by measuring tiny infrared absorption during transits and matching those dips to known molecular lines. The next decade looks promising.
FAQ
Q: What is infrared spectroscopy in exoplanet studies?
A: Infrared spectroscopy in exoplanet studies is a technique that measures infrared light absorbed or emitted by a planet’s atmosphere, revealing molecular fingerprints like water, methane, and carbon dioxide during transits or thermal observations.
Q: How do transit observations collect infrared data?
A: Transit observations collect infrared data by comparing a star’s spectrum while the planet passes in front (in-transit) to the out-of-transit spectrum, isolating wavelength-dependent absorption from the planet’s atmosphere.
Q: Why do absorption wavelengths correspond to specific molecules?
A: Absorption wavelengths correspond to specific molecules because molecular vibrations and rotations absorb distinct infrared energies, so each molecule leaves a recognizable pattern of dips—its spectral fingerprint—in observed spectra.
Q: Which molecules are commonly detected and at what infrared wavelengths?
A: Common molecules detected are water vapor (strong bands near 1.4 and 2.7 microns), methane (around 3.3 microns), and carbon dioxide (near 4.3 microns), each with diagnostic absorption lines.
Q: How do scientists extract composition from spectral dips?
A: Scientists extract composition from spectral dips by matching observed absorption features to laboratory molecular line lists, then using retrieval models and statistical fits to estimate abundances and atmospheric structure.
Q: What role did JWST play in advancing infrared exoplanet spectroscopy?
A: JWST advanced infrared exoplanet spectroscopy by delivering high-resolution, sensitive NIRSpec and MIRI spectra since 2022, revealing water, carbon dioxide, clouds, and hazes in several exoplanet atmospheres.
Q: What are the main limitations and challenges in infrared exoplanet spectroscopy?
A: Main limitations include cloud or haze muting spectral features, stellar activity adding noise, limited instrument sensitivity for small planets, and overlapping molecular bands causing ambiguity in identification.
Q: How do temperature and scattering affect infrared spectra?
A: Temperature and scattering affect infrared spectra by shifting line strengths, adding thermal emission, and smoothing or redistributing wavelengths through scattering, which complicates molecule identification and abundance estimates.
Q: What does the retrieval workflow look like for spectral data analysis?
A: The retrieval workflow is data calibration, noise reduction, spectral fitting with physical models, and statistical inference—usually Bayesian—to estimate gas abundances, temperature profile, and confidence intervals.
Q: What future telescopes or missions will improve infrared exoplanet characterization?
A: Future missions like ARIEL and the proposed Habitable Worlds Observatory will expand infrared coverage and spectral resolution, enabling studies of smaller, Earth-size planets and improved atmospheric composition surveys.