
What lets a telescope turn a faint dot into a chemical report and a speed reading?
Spectroscopy splits light into a detailed rainbow, like a barcode or fingerprint, that reveals composition, temperature, motion, and distance.
This post explains the common spectroscopy techniques used in major telescope discoveries, including optical, infrared, radio, ultraviolet and X-ray, transit, and Doppler, and shows how each method produced breakthroughs from finding exoplanets to mapping dark energy.
You’ll get clear, practical steps on how each technique works, what instruments make it possible, and what real discoveries they enabled.
Core Spectroscopy Techniques Behind Major Telescope Breakthroughs
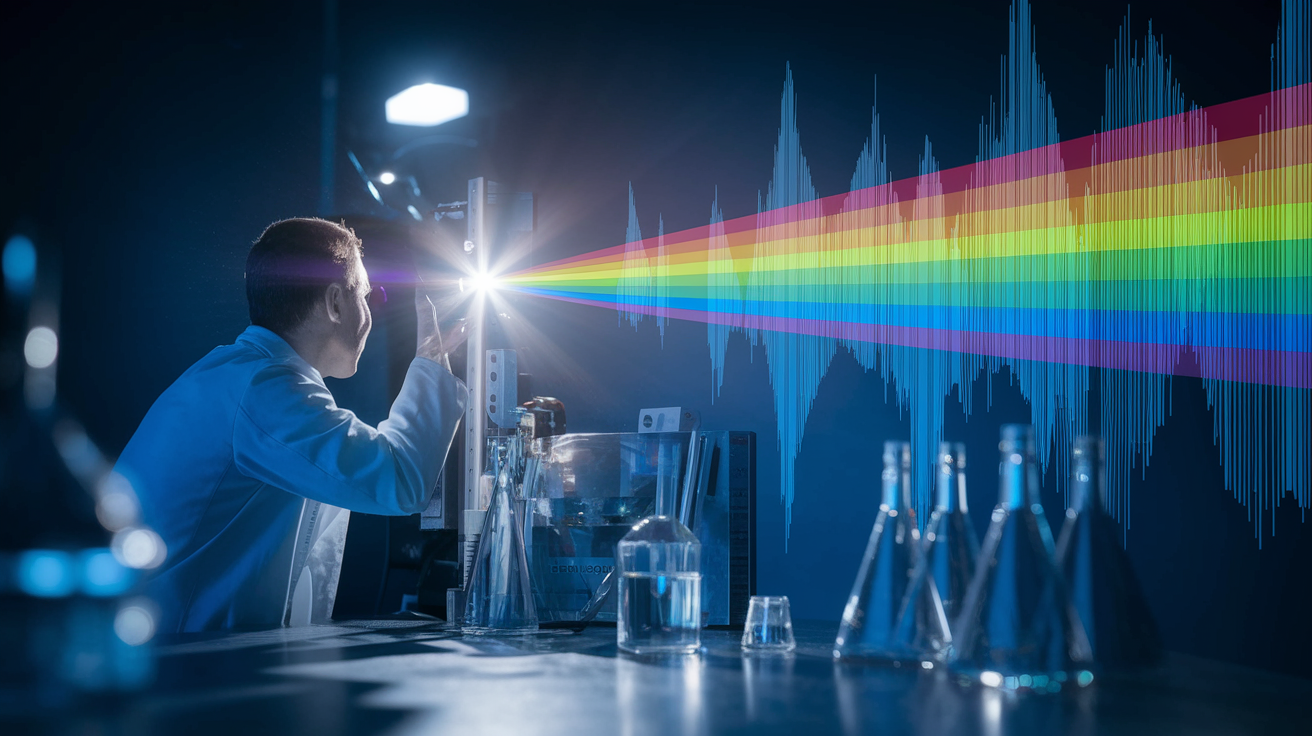
Spectroscopy measures the hundreds of colors hidden inside a single beam of light from space. Regular imaging captures direction and brightness. Spectroscopy splits that light into a detailed rainbow that shows chemical makeup, temperature, density, and motion. A spectrum looks like peaks and valleys, each one tied to a specific element or molecule absorbing or emitting light at a particular wavelength. Detectors like CCDs, photodiodes, and photomultiplier tubes turn those patterns into data.
Absorption lines show up when cooler gas sits between us and a hotter light source. The gas soaks up photons at specific wavelengths, leaving dark gaps. Emission lines appear when hot or excited gas radiates photons, creating bright spikes. Astronomers match these fingerprints to lab measurements to identify which elements are present and how fast the source is moving. Doppler shift stretches or compresses wavelengths when an object moves toward or away from us. That turns spectroscopy into a speedometer for stars, galaxies, and planets.
Redshift is stretched light caused by the expanding universe, and it’s used to figure out how far away a galaxy sits. Without spectroscopy, telescopes can point at something but can’t directly measure its distance or composition. That’s why big discoveries depend on spectroscopic techniques, from the first exoplanets to dark energy surveys mapping billions of light years. Here are the five core methods:
- Optical spectroscopy – visible light spectra showing stellar types, galaxy redshifts, and elemental abundances.
- Infrared spectroscopy – cuts through dust and detects cool objects, early galaxies, and molecular signatures in exoplanet atmospheres.
- Radio line spectroscopy – maps cold molecular gas and galactic structure through emissions invisible to optical telescopes.
- Ultraviolet and X-ray spectroscopy – probes hot plasmas, black hole accretion disks, and high energy processes.
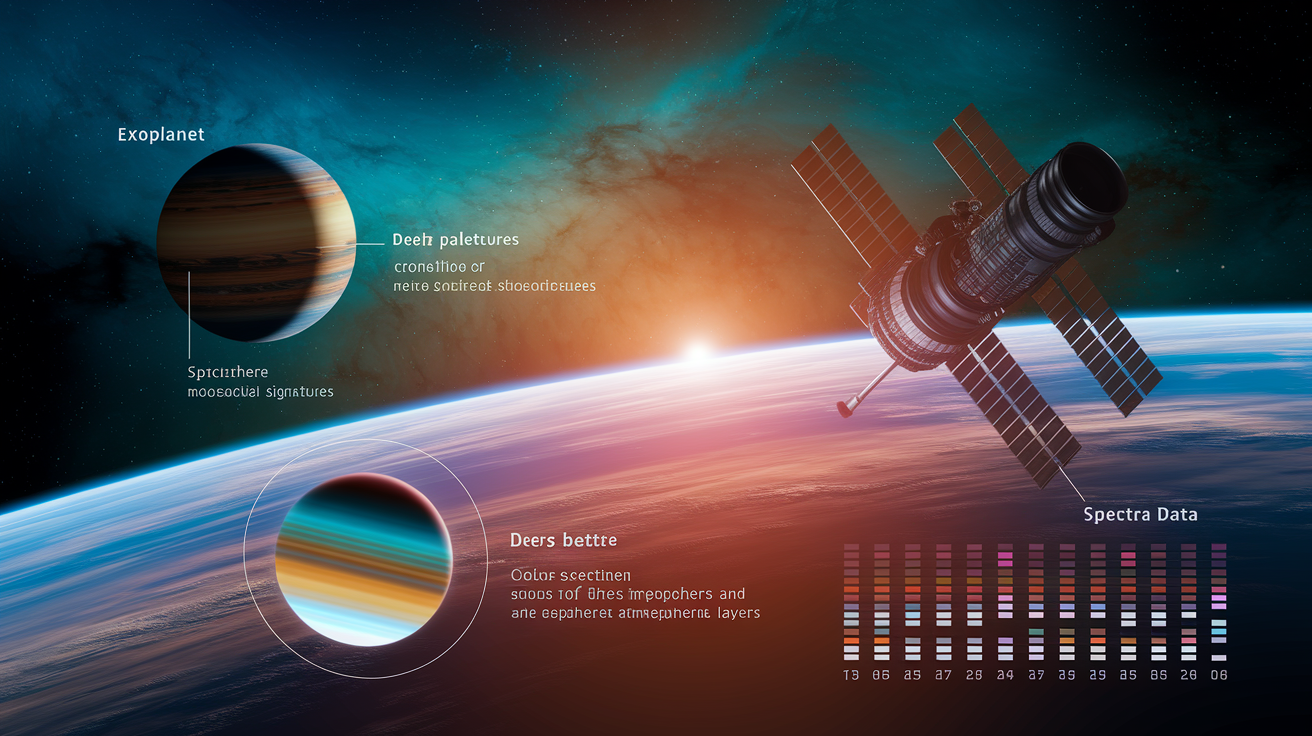
- Transit spectroscopy – measures exoplanet atmospheres by comparing stellar light before, during, and after a planet crosses in front of its star.
Optical Spectroscopy in Telescope Discoveries
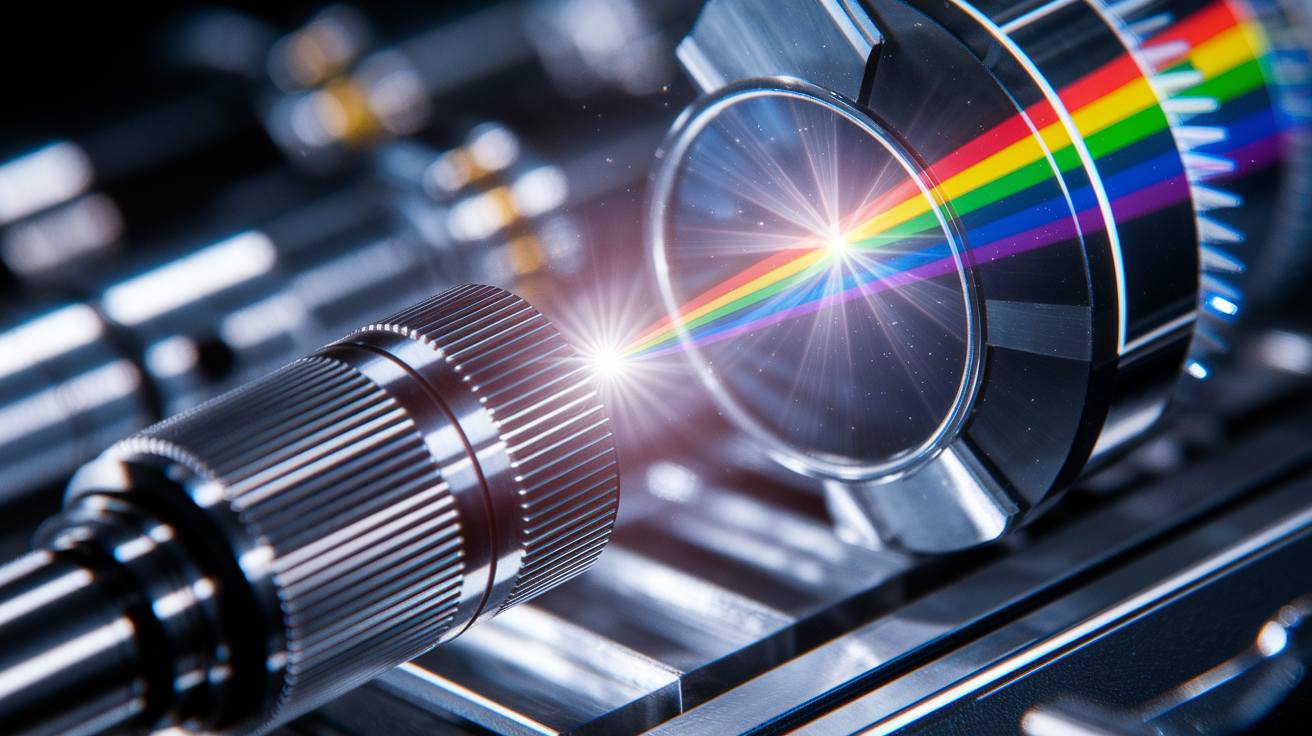
Optical spectroscopy separates visible light into line patterns that indicate temperature, composition, and velocity. When starlight passes through a diffraction grating or prism inside a spectrograph, it spreads into a spectrum dotted with dark absorption lines from elements in the star’s atmosphere and bright emission lines from surrounding nebulae or galaxies. Large cosmological surveys depend heavily on optical spectra to measure redshifts for millions of galaxies. That turns two-dimensional sky images into three-dimensional cosmic maps. The Baryon Oscillation Spectroscopic Survey recorded spectra for 1.5 million galaxies by 2014, giving astronomers the statistical power needed to study dark energy and large scale structure.
High resolution echelle spectrographs split optical light across many overlapping spectral orders. They reach the precision needed to measure stellar oscillations, chemical abundances in ancient stars, and sub-meter-per-second Doppler shifts caused by orbiting planets. These instruments do the heavy lifting behind stellar classification (sorting stars into spectral types O, B, A, F, G, K, M based on line strengths), detection of high redshift galaxies whose optical emission lines have been shifted into near infrared wavelengths, and confirmation of supernova distances used to discover the accelerating expansion of the universe.
| Technique | Key Discovery |
|---|---|
| Low-resolution optical spectroscopy | Galaxy redshift surveys mapping cosmic structure |
| High-resolution echelle spectroscopy | First exoplanet detections via radial velocity (51 Pegasi b, 1995) |
| Multi-object fiber spectroscopy | SDSS catalog of millions of galaxies and quasars |
| Integral-field spectroscopy | Spatially resolved dynamics and chemistry in nearby galaxies |
Infrared Spectroscopy and JWST’s Breakthroughs
Infrared spectroscopy cuts through dust clouds that block visible light and reveals cooler structures invisible to optical telescopes. The expanding universe stretches light from distant galaxies into longer wavelengths, so early galaxies that formed less than a billion years after the Big Bang now shine brightest in the infrared. JWST’s NIRSpec instrument can simultaneously capture spectra of up to 100 targets across the near infrared. It identifies chemical fingerprints such as ionized oxygen lines in galaxies that formed when the universe was only a few hundred million years old. These spectra confirm redshifts and measure the physical conditions inside the first generation of star forming regions.
JWST’s mid infrared instruments have detected water vapor, carbon dioxide, methane, and carbon monoxide in exoplanet atmospheres by comparing the star’s spectrum before, during, and after the planet transits. When the planet crosses in front of its star, a tiny fraction of starlight filters through the planet’s atmosphere, picking up absorption features tied to specific molecules. JWST measured a clear carbon dioxide signature at 4.3 micrometers in the atmosphere of WASP-39 b, a hot gas giant. That confirmed infrared spectroscopy can reliably detect atmospheric chemistry even around distant worlds.
NIRSpec’s multi-object capability transforms infrared spectroscopy from a one target at a time technique into a survey tool. Instead of spending hours on a single galaxy, astronomers can simultaneously measure spectra for dozens of faint, high redshift sources. That builds statistical samples revealing how galaxies assembled, how quickly they formed stars, and what elements they contained. The four molecules most commonly targeted in exoplanet infrared spectra are:
- Water vapor (H₂O), broad absorption across near and mid infrared wavelengths.
- Carbon dioxide (CO₂), strong feature near 4.3 micrometers, diagnostic of atmospheric chemistry.
- Methane (CH₄), absorption bands around 3.3 micrometers, often searched for as a potential biosignature.
- Carbon monoxide (CO), detected in hot exoplanet atmospheres, indicating carbon rich chemistry.
Radio Spectroscopy and Molecular Line Discovery
Radio spectroscopy detects molecular transitions that occur at wavelengths measured in millimeters to meters. It reveals cold gas and chemistry invisible to optical and infrared telescopes. Molecules such as carbon monoxide, ammonia, water, and complex organics radiate at specific radio frequencies when their rotational energy states flip. These emission lines act as tracers of star forming regions, molecular clouds, and the dense material feeding supermassive black holes. Observatories such as ALMA generate three dimensional velocity fields by measuring how line frequencies shift across a galaxy, mapping rotation, infall, and outflows with spatial precision.
The 21 centimeter hydrogen line is produced when the electron in a hydrogen atom flips its spin relative to the proton. It maps neutral atomic gas across galaxies and intergalactic space. Hydrogen is the most abundant element in the universe, so this single spectral line provides a direct census of galactic structure, rotation curves, and dark matter halos. Radio surveys using the 21-cm line have measured the mass distribution in thousands of galaxies, confirming that visible matter accounts for only a small fraction of total gravitational mass.
| Line/Species | Discovery Enabled |
|---|---|
| 21-cm neutral hydrogen (HI) | Galactic rotation curves and dark-matter evidence |
| Carbon monoxide (CO) rotational lines | Mapping molecular clouds and star-formation rates |
| Water maser emission | Accurate distances to star-forming regions via parallax |
| Complex organic molecules (formaldehyde, methanol) | Prebiotic chemistry in protostellar disks |
Measuring Motion: Doppler Spectroscopy and Radial Velocity Discoveries
Doppler shifts turn spectroscopy into a precision speedometer by measuring how much spectral lines shift when an object moves toward or away from Earth. A star orbited by a planet wobbles slightly, pulled by the planet’s gravity. That wobble produces a periodic shift in the star’s spectrum. When the star moves toward us, all its spectral lines shift to shorter (bluer) wavelengths. When it moves away, the lines stretch to longer (redder) wavelengths. Astronomers compare the observed spectrum to a reference template taken in the lab and measure the star’s radial velocity, the component of motion along our line of sight, with precision down to a meter per second or better.
The first confirmed exoplanet orbiting a Sun-like star, 51 Pegasi b, was discovered in 1995 using the radial velocity method. High precision instruments such as HARPS and HIRES achieved the stability needed to detect the few-meter-per-second wobbles induced by Jupiter-mass planets and, eventually, super-Earths. These spectrographs use temperature controlled environments, vacuum chambers, and fiber optics to eliminate instrumental drifts that could mimic or hide planetary signals. Cross correlation fitting compares thousands of spectral lines simultaneously, averaging out noise and extracting velocities with sub-pixel accuracy.
Calibration is everything in radial velocity work. Early instruments used thorium-argon arc lamps to define wavelength references, but stellar activity, temperature changes, and instrumental flexure introduced systematic errors. Modern spectrographs employ laser frequency combs, devices that generate evenly spaced reference lines across the entire spectrum with metrological precision. Some use gas absorption cells (iodine or methane) that imprint stable reference features directly onto the stellar spectrum. These advances pushed radial velocity sensitivity from tens of meters per second in the 1990s to the current threshold where Earth mass planets in habitable zones around quiet stars become detectable.
Calibration and Data Reduction in Modern Spectroscopy

High quality spectra depend on a careful sequence of detector corrections and wavelength calibration before any science can be extracted. Raw spectrograph data contain pixel to pixel sensitivity variations, cosmic ray hits, and instrumental signatures that must be removed. Flat fielding corrects for uneven detector response by dividing the science exposure by images of a uniformly illuminated screen. Dark frames subtract thermal noise. Bias frames remove readout offsets. Cosmic rays, high energy particles that leave bright streaks on CCDs, are identified and masked using statistical rejection algorithms that compare multiple exposures.
Wavelength calibration assigns a precise wavelength to each pixel in the spectrum. Arc lamps filled with thorium and argon emit hundreds of narrow emission lines at known laboratory wavelengths, providing a reference grid. The calibration software fits a polynomial or spline function that maps pixel position to wavelength, accounting for optical distortions and detector tilt. Laser frequency combs improve on arc lamps by generating thousands of evenly spaced lines with absolute frequency stability traceable to atomic clocks. That enables sub-pixel wavelength accuracy across broad spectral ranges. Gas absorption cells, placed in the light path during observation, imprint stable molecular features (iodine or methane lines) directly onto the stellar spectrum, allowing simultaneous wavelength calibration and science measurement.
Telluric correction removes Earth’s atmospheric features from ground based spectra. Water vapor, oxygen, and other molecules in our atmosphere absorb light at specific wavelengths, leaving absorption bands that can mimic or obscure astrophysical signals. Astronomers observe hot, featureless standard stars to measure the telluric spectrum, then divide it out of the science target’s spectrum. Space telescopes avoid this complication entirely but introduce their own calibration challenges, such as detector aging, radiation damage, and thermal drifts. The standard calibration sequence is:
- Subtract bias and dark frames to remove electronic offsets and thermal noise.
- Divide by flat field images to correct pixel to pixel sensitivity variations.
- Identify and mask cosmic ray hits using statistical rejection or comparison exposures.
- Extract one dimensional spectra from two dimensional detector images and apply wavelength calibration using arc lamps, frequency combs, or absorption cells.
Spectroscopy in Large Astronomical Surveys
Multi-object spectrographs let a single telescope observe dozens or hundreds of targets simultaneously. That transforms spectroscopy from a slow, one object at a time process into a survey tool capable of mapping millions of galaxies. Optical fibers positioned at the focal plane carry light from individual targets to a shared spectrograph, where all spectra are dispersed and recorded on a single detector. The Baryon Oscillation Spectroscopic Survey used 1,000 fibers on the Sloan telescope to measure redshifts for 1.5 million galaxies by 2014. That provided the three dimensional cosmic map needed to measure dark energy’s influence on the universe’s expansion history. A next generation survey under development aims to collect spectra for 20 million galaxies, improving statistical sensitivity to baryonic acoustic oscillations and large scale structure.
Spectroscopic surveys convert redshift measurements into distance estimates. Two dimensional images become three dimensional catalogs that reveal how galaxies cluster, how voids grow, and how dark energy shapes cosmic evolution. The Dark Energy Spectroscopic Instrument expands fiber count to 5,000, enabling faster and deeper surveys that reach fainter and more distant targets. Each night, robotic positioners adjust fiber tips to align with pre-selected galaxies, quasars, and stars. That maximizes observing efficiency and builds datasets large enough to detect subtle cosmological signals buried in the noise of galaxy clustering.
Major spectroscopic survey instruments include:
- SDSS/BOSS, optical fiber spectroscopy of millions of galaxies and quasars, mapping large scale structure and dark energy.
- DESI, 5,000-fiber multi-object spectrograph, targeting 40 million redshifts to constrain dark energy evolution.
- APOGEE, near infrared survey of stellar abundances and kinematics across the Milky Way, penetrating dust to map the galactic disk and bulge.
- MUSE, optical integral field spectrograph capturing full spectra at every pixel in a small field, revealing spatially resolved galaxy dynamics and chemistry.
- ALMA, radio spectroscopy of molecular lines in distant galaxies, tracing star formation, gas kinematics, and chemical enrichment across cosmic time.
Final Words
We jumped straight into how astronomers split starlight into hundreds of colors, then used optical, infrared, radio, ultraviolet/X-ray and transit methods to read those fingerprints.
You saw how absorption and emission lines reveal composition, how Doppler shifts and redshift measure motion and distance, and how careful calibration and big surveys make the results trustworthy.
Bottom line: common spectroscopy techniques used in major telescope discoveries turn faint spectral lines into clear science, and with sharper instruments ahead, there’s more to discover.
FAQ
Q: What are the common spectroscopic techniques and the four main types of spectroscopy?
A: The common spectroscopic techniques and four main types are optical, infrared, ultraviolet/X-ray, and radio spectroscopy; plus methods like Doppler (radial velocity) and transit spectroscopy to read chemical fingerprints and motion.
Q: Do telescopes use spectroscopy?
A: Telescopes do use spectroscopy to split light into many colors, revealing composition, temperature, and motion; both ground and space observatories carry spectrometers across optical, IR, radio, and X‑ray bands.
Q: What type of spectroscopy is used in the James Webb telescope?
A: The James Webb Space Telescope uses infrared spectroscopy, chiefly NIRSpec (near‑IR) and MIRI (mid‑IR), for exoplanet atmospheres, redshifted early galaxies, and chemical fingerprints via transit and emission/absorption lines.