
Can a single number from a satellite really tell you if plants are healthy?
NDVI (Normalized Difference Vegetation Index) is a simple ratio that compares near-infrared and red light reflected by the surface.
Healthy leaves reflect lots of near-infrared and soak up red, so NDVI highlights vigor as a number between −1 and +1.
But that number can mean different things depending on soil, clouds, sensor, and canopy density.
We’ll show you what common NDVI ranges actually indicate, how the calculation works, and quick checks to avoid misreading a green patch on a map.
Understanding NDVI Values and Their Meaning
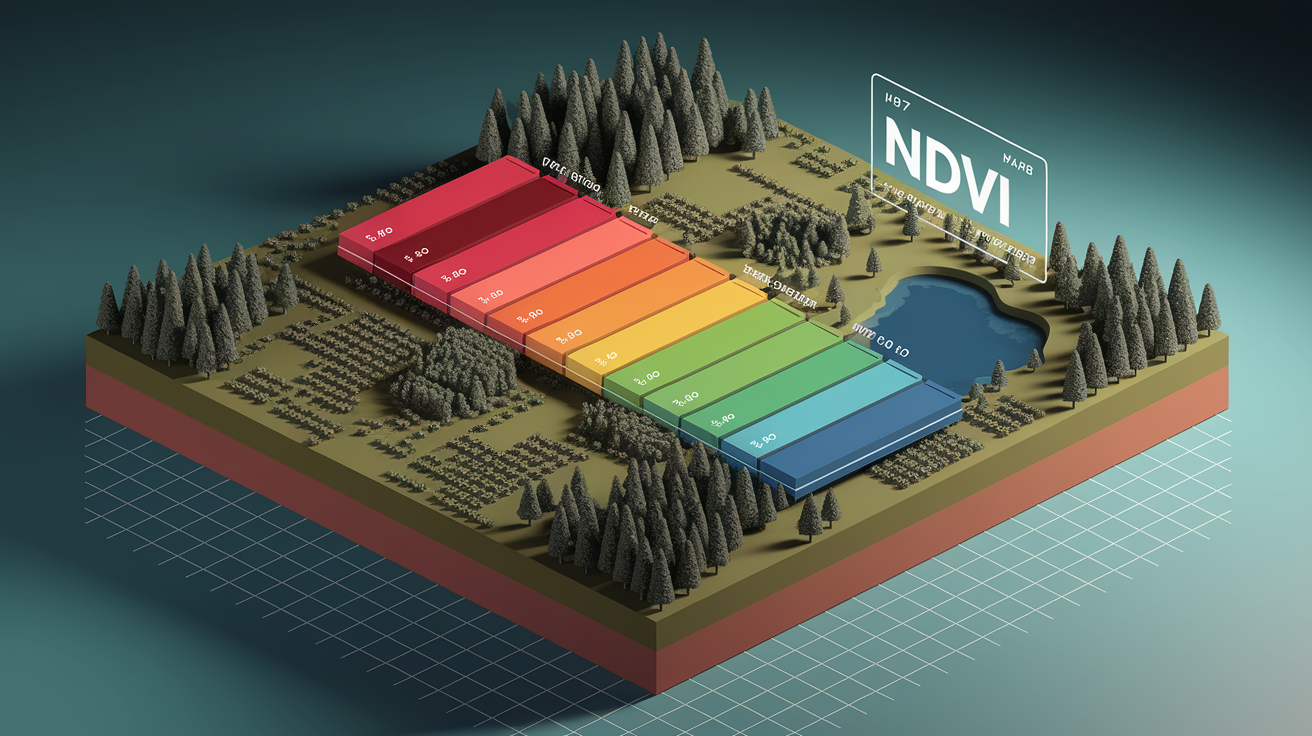
NDVI (Normalized Difference Vegetation Index) is a calculated measurement running from −1.0 to +1.0. It uses two wavelengths of reflected light—near-infrared and red—to estimate how much photosynthetically active vegetation is present in a pixel. The index works because healthy leaves reflect a lot of near-infrared light and absorb most red light, creating a strong contrast. When you plug those reflectance numbers into the formula, you get a single value that summarizes vegetation health and density. Non-vegetated surfaces like water, clouds, or bare rock produce very different patterns and land in predictable parts of the scale.
Each numeric range on the NDVI scale corresponds to a specific type of surface or vegetation condition. Water, snow, and clouds typically return values between −1.0 and 0.0 because they reflect more red than near-infrared. Bare soil and very sparse vegetation sit near 0.0 to 0.2, producing minimal contrast between the two bands. Sparse or stressed vegetation (think shrubland or young crops under mild stress) usually appears in the 0.2 to 0.5 range. Healthy, dense vegetation like mature crops or temperate forests typically registers between 0.5 and 0.9. Values above 0.8 often indicate very high leaf density, though NDVI can saturate in extremely dense canopies and lose sensitivity.
Here’s a quick example using Sentinel‑2 imagery. Say Band 8 (NIR) returns a reflectance of 0.45 and Band 4 (Red) returns 0.08. Plug those into the formula: (0.45 − 0.08) / (0.45 + 0.08) = 0.37 / 0.53, which gives you about 0.70. That value falls in the high-vigor range, suggesting a healthy, dense canopy. On Landsat 8, you’d use Band 5 (NIR) and Band 4 (Red) the same way. Either sensor will give you a comparable NDVI when the imagery is calibrated and cloud-free.
| Value Range | Surface Type | Typical Interpretation |
|---|---|---|
| −1.0 to 0.0 | Water, clouds, snow, bare rock | Non-vegetated; often indicates surface water or atmospheric features |
| 0.0 to 0.2 | Bare soil, very sparse vegetation | Minimal plant cover; soil-dominated reflectance |
| 0.2 to 0.5 | Sparse or stressed vegetation | Shrubland, early-stage crops, or mild stress |
| 0.5 to 0.9 | Healthy, dense vegetation | Mature crops, temperate/tropical forests, high biomass |
How NDVI Is Calculated from Satellite Bands
NDVI uses a simple ratio formula: (NIR − Red) / (NIR + Red). You subtract the red reflectance from the near-infrared reflectance, then divide by their sum. This normalization keeps the output between −1 and +1 no matter what the absolute brightness of the surface is. It’s designed to amplify the signal from chlorophyll, which absorbs red light strongly while healthy leaves scatter near-infrared light in all directions. When you run this calculation pixel by pixel across a satellite image, you end up with a map showing where vegetation is dense, where it’s sparse, and where there’s no vegetation at all.
Different satellites label their bands differently, but the core idea stays the same. Sentinel‑2, Landsat 8, and other multispectral platforms each carry a red band and a near-infrared band calibrated to capture the chlorophyll signature. Once you know which bands to use, the math is identical. Most satellite-processing software will let you type the formula directly or choose NDVI from a preset list, and it handles the band selection automatically.
Sentinel‑2: Use Band 8 (NIR, centered near 842 nm) and Band 4 (Red, centered near 665 nm). Some platforms also offer Band 8A (narrow NIR) for specialized work.
Landsat 8 and Landsat 9: Use Band 5 (NIR, centered near 865 nm) and Band 4 (Red, centered near 655 nm).
MODIS: Typically uses Band 2 (NIR, 841–876 nm) and Band 1 (Red, 620–670 nm) for daily or 16-day composite NDVI products.
Final Words
Jump right in: NDVI gives you a -1 to +1 score that separates water, soil, stressed plants, and healthy greens. We showed the typical ranges and what each means, and how Sentinel-2 (B8/B4) or Landsat 8 (B5/B4) supply the NIR and red bands.
You also saw the simple formula (NIR − Red)/(NIR + Red) and a quick example calculation so you can try it yourself.
If you want to practice, pull a Sentinel-2 scene and try converting pixels, it’s a solid first step for learning how to interpret NDVI values from satellite imagery, and it gets easier fast.
FAQ
What does NDVI stand for and measure?
NDVI stands for Normalized Difference Vegetation Index, a satellite-based measurement that quantifies plant health and density by comparing how surfaces reflect near-infrared light versus visible red light on a scale from -1 to +1.
How do you interpret NDVI values?
NDVI values are interpreted by range: negative values indicate water or clouds, 0 to 0.2 shows bare soil, 0.2 to 0.5 represents sparse or stressed vegetation, and 0.5 to 0.9 indicates healthy, dense plant cover.
What NDVI value indicates healthy vegetation?
Healthy vegetation typically registers NDVI values between 0.5 and 0.9, with denser forests and crops during peak growing season often reaching the upper end of this range.
What causes low NDVI readings?
Low NDVI readings are caused by surfaces that reflect little near-infrared light, including water bodies, bare soil, exposed rock, urban pavement, or vegetation under drought stress or early growth stages.
Which satellites provide NDVI data?
Satellites that provide NDVI data include Sentinel-2, which uses bands 4 and 8, and Landsat 8, which uses bands 4 and 5, both offering the red and near-infrared channels required for calculation.
How is the NDVI formula applied to satellite imagery?
The NDVI formula is applied by subtracting the red band reflectance from near-infrared reflectance, then dividing by their sum: (NIR − Red) / (NIR + Red), producing a normalized index value.
Can NDVI detect crop stress before visible symptoms appear?
NDVI can detect crop stress before visible symptoms appear because stressed plants reduce near-infrared reflectance earlier than they change color, allowing farmers to identify problem areas from satellite data.
What is the difference between NDVI and other vegetation indices?
NDVI differs from other vegetation indices by using a simple normalized ratio of red and near-infrared bands, while alternatives like EVI add corrections for atmospheric interference or soil background noise.