
Could a single telescope really spot galaxies that formed just a few hundred million years after the Big Bang?
JWST did it by catching infrared light — ancient ultraviolet photons stretched longer by cosmic expansion, a process called redshift (wavelengths shift toward redder, longer light).
Its NIRCam camera uses multiple filters to find objects that “drop out” of bluer bands where the Lyman break appears, flagging high-redshift candidates.
Then NIRSpec spectra confirm those candidates by measuring the break and faint emission lines.
We’ll explain how JWST’s cold mirror, detectors, imaging, and spectroscopy work together to find and confirm the earliest galaxies.
Core Explanation of JWST’s Method for Detecting the Earliest Galaxies
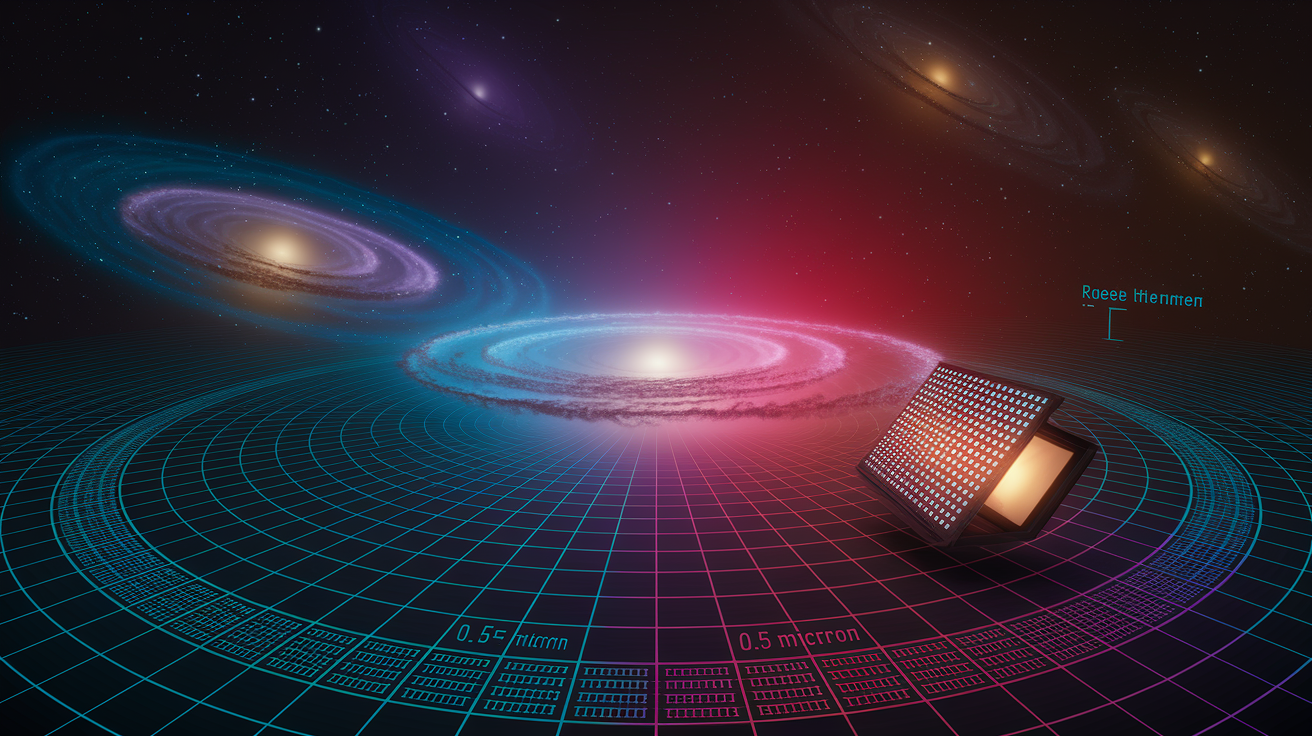
JWST finds the earliest galaxies by catching infrared light that began its journey as ultraviolet radiation billions of years ago. Cosmic expansion stretches every photon traveling through space, shifting shorter wavelengths into longer ones. This is redshift. Light emitted in the ultraviolet or visible range by stars in the first few hundred million years after the Big Bang has stretched so much that it reaches Earth as infrared radiation, invisible to us but perfectly matched to JWST’s instruments.
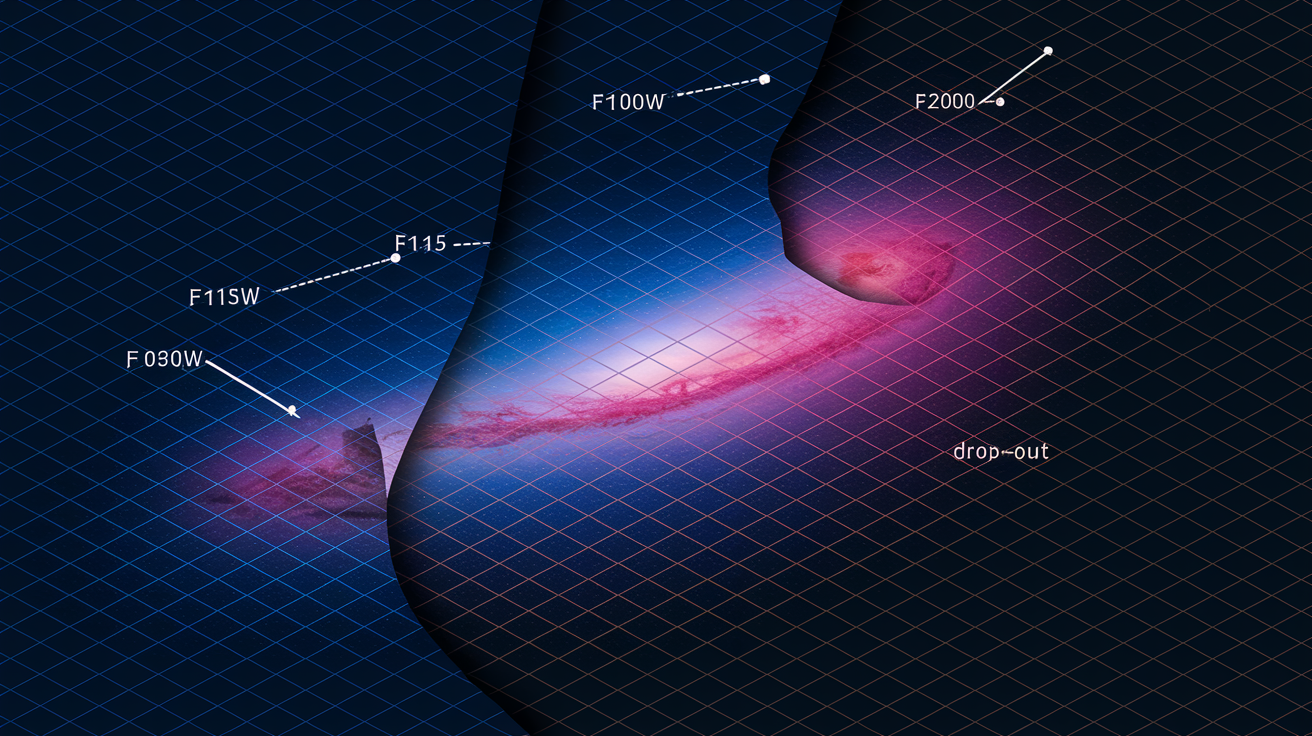
The Lyman break, an absorption edge at 912 Ångströms caused by neutral hydrogen in and around galaxies, becomes a marker when redshifted. At a redshift of z = 10, the Lyman break appears at about 1 micron in the near infrared. JWST’s NIRCam instrument captures images through multiple filters, each sensitive to a narrow slice of wavelength. Galaxies beyond the Lyman break “drop out” in filters that sample wavelengths shorter than the redshifted break. They appear in redder filters like F200W but vanish in bluer ones such as F090W, F115W, and F150W. This dropout signature flags candidates for follow up.
Confirmed discoveries include JADES-GS-z13-0 at redshift z = 13.20, meaning light left that galaxy roughly 400 million years after the Big Bang. Objects at z = 10 to z = 13 correspond to epochs between 500 and 400 million years after the universe began. JWST’s infrared coverage from 0.6 to 5 microns places these redshifted ultraviolet features squarely within its field of view.
The detection workflow follows these steps:
- Capture deep infrared images through multiple filters spanning 0.6 to 5 microns.
- Identify dropout candidates that disappear in short wavelength filters but remain visible in longer bands.
- Estimate photometric redshifts by modeling the shape of the dropout across filter sets.
- Select high priority candidates for spectroscopic confirmation to rule out interlopers and measure precise redshifts.
Engineering and Thermal Design Enabling JWST’s Infrared Sensitivity
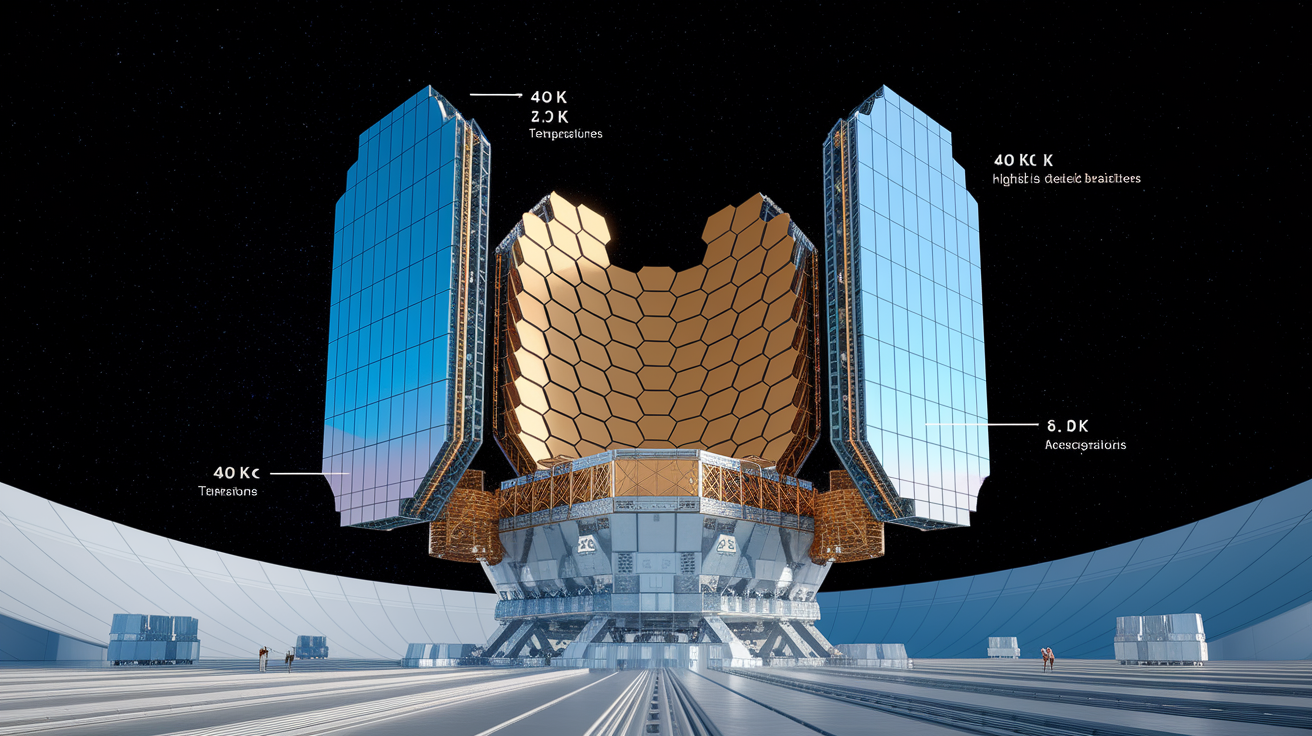
JWST operates near the second Lagrange point (L2), roughly 1.5 million kilometers from Earth, where a five layer sunshield keeps the telescope’s optics at approximately 40 Kelvin. This cryogenic environment matters because warm objects emit their own infrared radiation, which would overwhelm faint signals from distant galaxies. By cooling the mirrors, instruments, and detectors to temperatures far below the freezing point of nitrogen, JWST eliminates nearly all self-generated infrared glow. It becomes a passive receiver of ancient photons rather than a competing light source.
The infrared detectors aboard JWST cover wavelengths from 0.6 to 28 microns, far exceeding Hubble’s infrared limit of about 1.7 microns. Low detector noise, achieved through cooling and advanced semiconductor design, allows JWST to register individual photons from objects thousands of times fainter than Hubble could see in the infrared. Without Earth’s atmosphere absorbing and emitting infrared radiation, and without the thermal background from warm optics, JWST reaches sensitivity levels unattainable from the ground or from earlier space telescopes.
| System | Operating Temp | Engineering Impact |
|---|---|---|
| Telescope Optics | ~40 K | Eliminates thermal self-emission in near-infrared bands |
| MIRI Detectors | ~7 K | Extends sensitivity to 28 µm for mid-infrared spectroscopy |
| NIRCam/NIRSpec Detectors | ~40 K | Reduces read noise and dark current for faint-source imaging |
Thermal stability matters because even small temperature fluctuations can shift detector sensitivity or introduce spurious signals. JWST’s passive cooling design, relying on the sunshield rather than consumable cryogens, provides years of stable operation without the risk of coolant depletion that limited earlier infrared missions.
NIRCam’s Imaging Workflow for High-Redshift Surveys
Survey teams plan NIRCam observations by selecting filter sets that bracket the expected wavelengths of redshifted spectral features. Each filter samples a different slice of the infrared spectrum. The combination reveals where a galaxy’s light appears and where it drops out. Choosing the right filters means balancing wavelength coverage, exposure depth, and the total number of pointings across a field. Teams typically favor fields with existing deep data from Hubble or ground-based telescopes, allowing cross-checks and efficient candidate selection.
Mosaics and long integrations maximize the chance of detecting faint sources. A single NIRCam pointing covers a patch of sky, and multiple pointings tile together to form a mosaic. Within each pointing, the telescope accumulates light over many hours, sometimes days, to push below the noise floor and reveal objects invisible in shorter exposures. The JADES survey, for example, devoted 10 days of NIRCam imaging to the GOODS-South field, a region 15 times larger than Hubble’s Ultra Deep Field. They used filters including F090W, F115W, F150W, and F200W to sample wavelengths across the critical dropout zones.
Data reduction transforms raw images into candidate lists. After aligning and stacking exposures, astronomers measure the brightness of every detected object in each filter. Objects that vanish in the shortest wavelength filters but remain visible in redder bands become high redshift candidates, ranked by the strength and consistency of their dropout signature.
The imaging campaign workflow proceeds as follows:
- Define science goals and estimate redshift range of target galaxies.
- Select filter combinations that span the Lyman break at the expected observed wavelengths.
- Design mosaic layout to cover the chosen field with overlapping pointings for redundancy.
- Execute deep integrations, accumulating tens to hundreds of hours of exposure per filter.
- Reduce and calibrate data, then compile photometric catalogs and candidate lists for spectroscopic follow up.
NIRSpec Spectroscopy and the Confirmation of Early Galaxies

NIRSpec turns candidate lists into confirmed discoveries by dispersing light into spectra that reveal the precise wavelength of the Lyman break and any emission lines present. The instrument’s microshutter array consists of thousands of tiny shutters that can be opened or closed individually, letting astronomers place slits on up to about 100 targets across the field in a single exposure. This multi-object capability transforms efficiency. You can confirm dozens of high redshift candidates in a single observing program rather than one at a time.
Long exposures are critical because the faintest early galaxies deliver only a handful of photons per hour to the detector. The JADES team accumulated 28 hours of NIRSpec integration over a 3 day period to secure spectra of their highest priority candidates. Those exposures confirmed galaxies at redshifts z = 13.20, 12.63, 11.58, and 10.38, each showing the characteristic drop in flux shortward of the Lyman break. In some cases, faint emission lines from hydrogen or oxygen pinpoint the redshift with high precision.
Why Spectroscopy Is Essential
Photometric dropout signatures can be mimicked by objects that aren’t distant galaxies. Cool stars in our own galaxy can appear red and faint, dropping out of blue filters for entirely different reasons. Lower redshift galaxies with strong emission lines or Balmer breaks near 4000 Ångströms can also produce color combinations that resemble high redshift dropouts when viewed through a limited set of filters. Without a spectrum, these interlopers contaminate candidate samples and inflate the apparent abundance of early galaxies.
A spectrum separates the possibilities. The Lyman break produces a sharp, smooth drop in flux at a specific wavelength determined by redshift, and the presence or absence of emission lines at expected positions confirms the interpretation. Interlopers reveal themselves through unexpected spectral features or redshifts inconsistent with the photometric estimate. Spectroscopic confirmation also measures the redshift with precision that photometry can’t match, often to three or four decimal places, enabling accurate calculations of cosmic age and distance.
Long integration times push spectroscopy to the limits of JWST’s sensitivity. Spreading faint light across a spectrum dilutes the signal compared to imaging, so detecting the Lyman break or a faint emission line in a z > 10 galaxy demands tens of hours of exposure. Only in space, free from atmospheric absorption and the day-night cycle, can such exposures be accumulated without interruption.
Why JWST Sees What Hubble Could Not: Mirror Size and Sensitivity Advantages
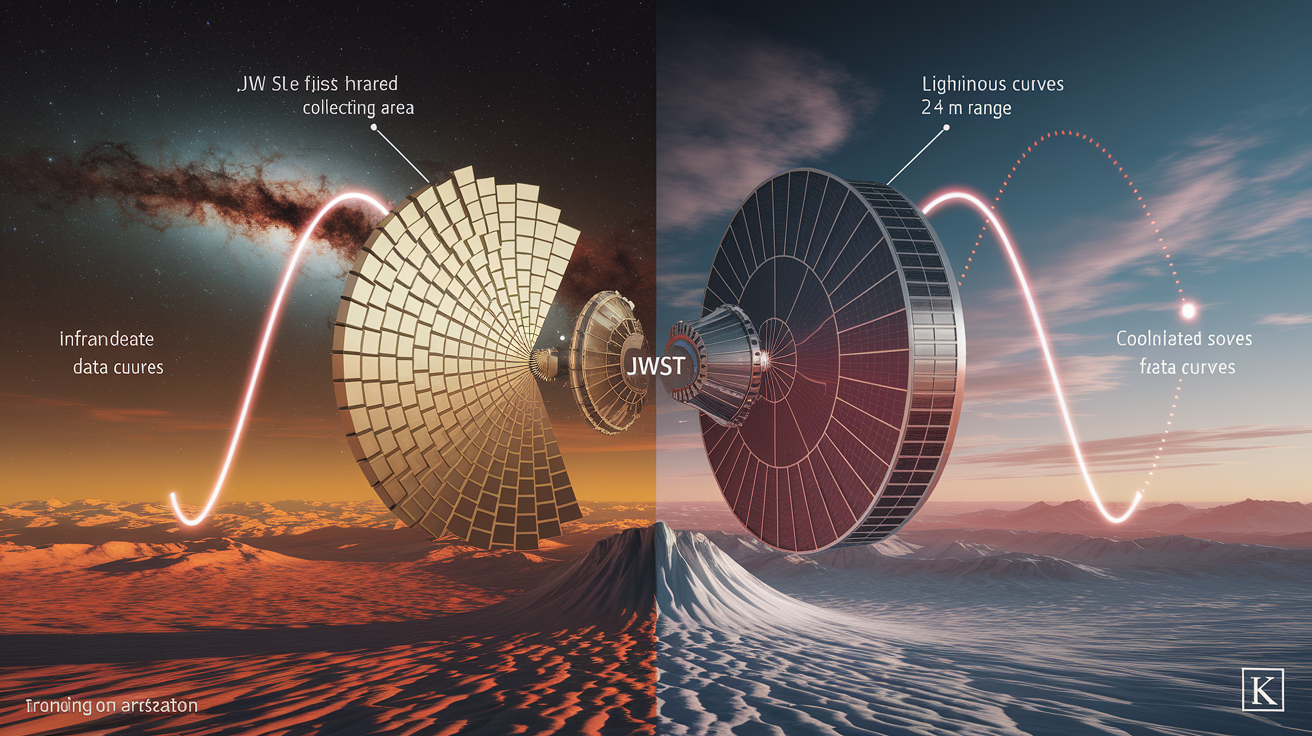
JWST’s primary mirror measures 6.5 meters in diameter, composed of 18 hexagonal segments coated in gold to maximize infrared reflectivity. Hubble’s mirror is 2.4 meters across. The ratio of collecting areas is approximately (6.5 / 2.4)² ≈ 7.3. JWST gathers more than seven times as much light as Hubble in a given exposure. For faint objects at the edge of detectability, that factor translates directly into shorter exposure times or the ability to see objects Hubble would miss entirely.
Operating temperature amplifies the advantage. Hubble’s instruments work near room temperature, so their infrared detectors register both cosmic photons and thermal emission from the telescope itself. JWST’s 40 Kelvin optics eliminate that self-generated background, pushing sensitivity in the infrared bands by orders of magnitude beyond what Hubble achieved. Ground-based telescopes face the same thermal problem, compounded by Earth’s atmosphere, which absorbs and emits strongly across much of the infrared spectrum and limits nightly observing windows to about 8 to 12 hours.
JWST’s advantages for detecting the earliest galaxies include:
- A collecting area more than seven times larger than Hubble’s, gathering far more light from faint, distant sources.
- Cryogenic operation near 40 Kelvin, eliminating thermal infrared background and enabling detection of objects invisible to warm telescopes.
- Infrared wavelength coverage extending to 28 microns, capturing redshifted ultraviolet light from galaxies at redshifts beyond Hubble’s reach.
Deep Field Imaging Strategies That Enable Early-Universe Discovery
Long exposure times improve the signal to noise ratio by letting faint photons accumulate while random detector noise averages out. A single short exposure of a blank patch of sky shows mostly noise with a few bright foreground stars. Stacking hundreds of such exposures in the same filter reveals progressively fainter objects as the real signal builds up faster than the noise. Deep fields push this strategy to its limit, investing tens or hundreds of hours of telescope time in small regions to reach the faintest possible sources.
JADES chose the GOODS-South field because it already held deep Hubble data and covered an area 15 times larger than the Hubble Ultra Deep Field. Larger fields increase the volume of the early universe sampled, raising the chance of finding rare, distant galaxies and reducing the effects of cosmic variance, where random clustering can make small regions unrepresentative of the universe as a whole. JADES executed 10 days of continuous NIRCam imaging across multiple filters, building up depth while maintaining broad wavelength coverage.
Stacking exposures demands careful calibration. Each raw image includes cosmic ray hits, detector artifacts, and small pointing drifts. Pipeline software aligns frames to sub-pixel precision, rejects outliers, and combines the data into a single deep image where noise is suppressed and faint galaxies emerge. The same process repeats for every filter, producing a multi-wavelength image cube that forms the foundation for dropout selection and photometric redshift estimation.
Calculating Age and Distance: How Redshift Translates to Cosmic Time
Astronomers convert redshift measurements into cosmic age and distance using the ΛCDM cosmological model, which describes how the universe expands over time based on its contents of ordinary matter, dark matter, and dark energy. The model requires input parameters such as the Hubble constant (H₀, the current expansion rate) and the relative densities of matter and dark energy. Given a redshift z, the model calculates the lookback time, the interval between the emission of the light and its observation today, and the comoving distance, the spatial separation accounting for expansion.
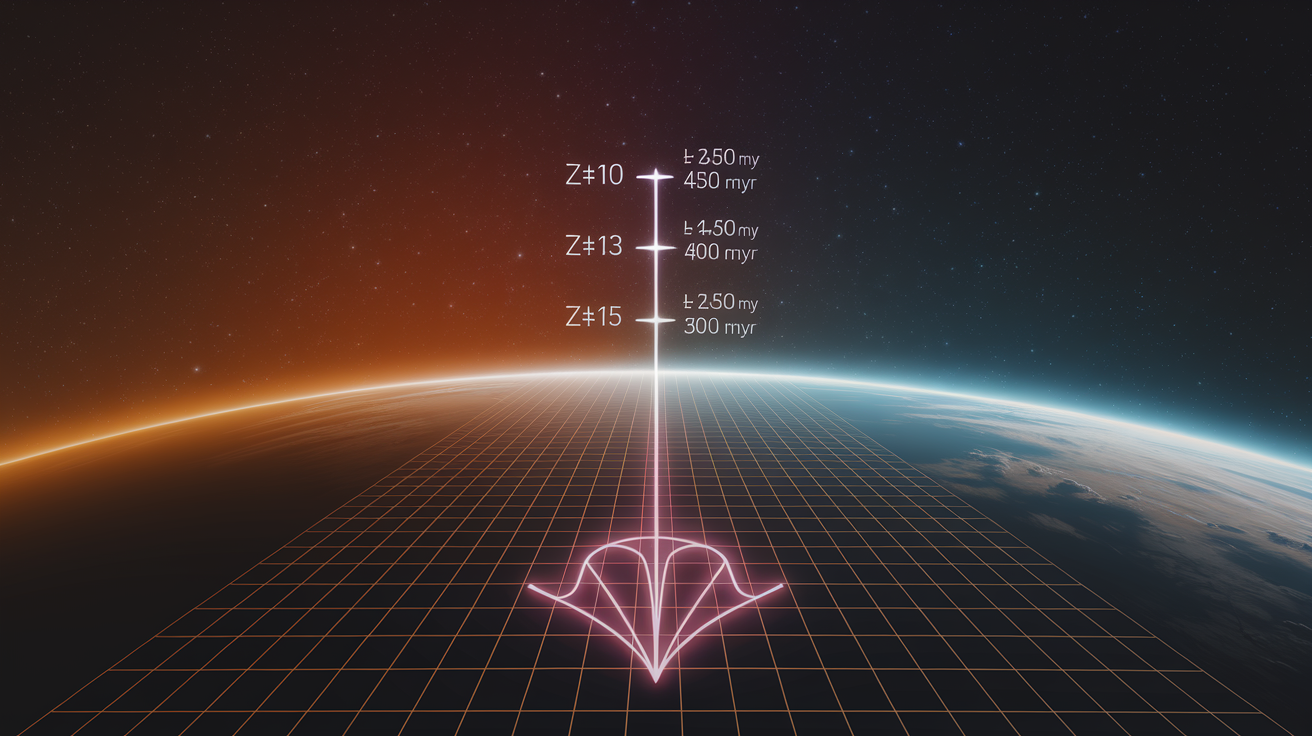
At a redshift of z ≈ 10, the universe was roughly 500 million years old, about 3.6 percent of its current age of 13.8 billion years. Light from that epoch has traveled for more than 13 billion years to reach us, stretched by a factor of (1 + z) = 11 in wavelength. At z ≈ 15, the age drops to approximately 250 to 300 million years, placing the galaxy within the first few percent of cosmic history. These conversions rely on precise measurements of cosmological parameters, primarily from the cosmic microwave background and large-scale galaxy surveys.
| Redshift | Wavelength Stretch | Universe Age |
|---|---|---|
| z = 10 | × 11 | ~500 million years |
| z = 13 | × 14 | ~400 million years |
| z = 15 | × 16 | ~250–300 million years |
| z = 0 (today) | × 1 | ~13.8 billion years |
Photometric redshifts come from fitting model spectra to multi-filter brightness measurements, while spectroscopic redshifts come from identifying emission or absorption lines at known rest wavelengths. A spectroscopic redshift of z = 13.20 means the Lyman-alpha line, normally at 1216 Ångströms, appears at 1216 × (1 + 13.20) ≈ 17,270 Ångströms, or 1.73 microns in the near infrared. That precision enables lookback time calculations accurate to within a few million years, turning redshift into a direct probe of cosmic history.
JADES and CEERS: Survey Programs Behind the Record-Breaking Discoveries
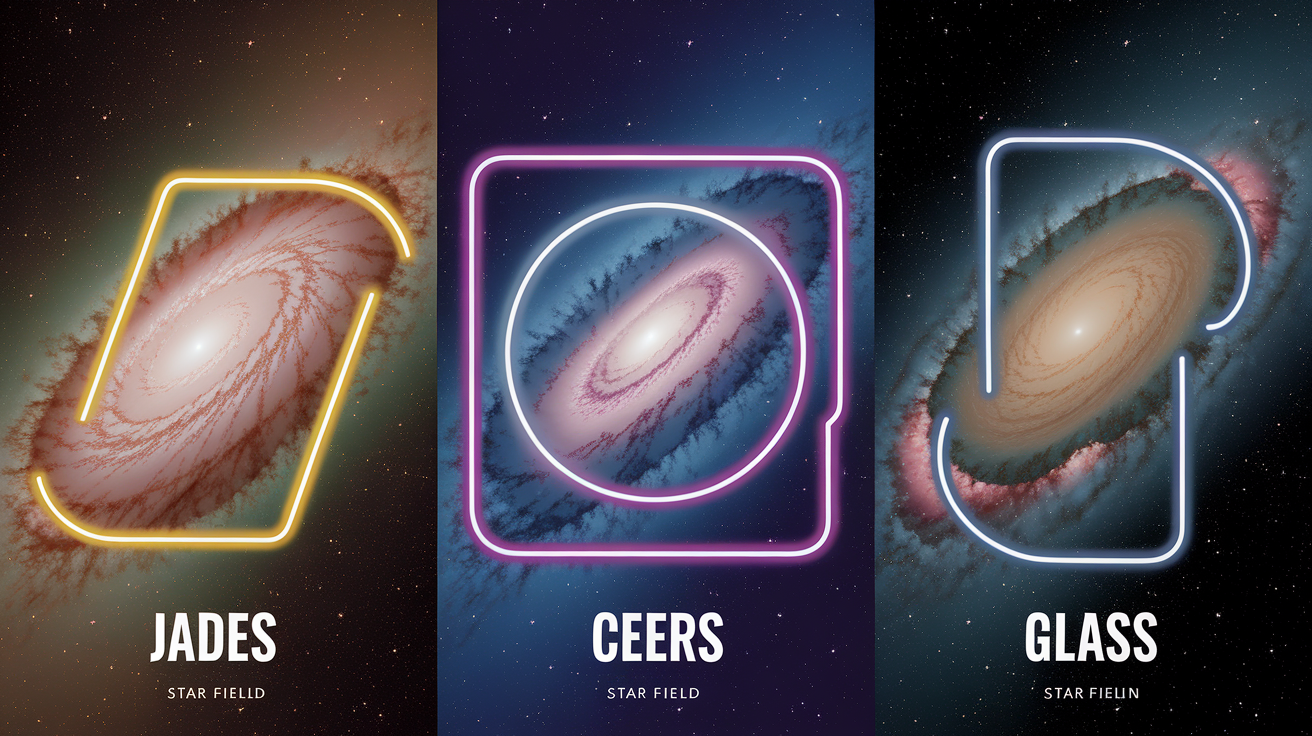
The JWST Advanced Deep Extragalactic Survey (JADES) combined NIRCam imaging and NIRSpec spectroscopy to identify and confirm galaxies in the first few hundred million years after the Big Bang. JADES confirmed four galaxies beyond redshift z = 10 with spectroscopic redshifts of 13.20, 12.63, 11.58, and 10.38. The program plans to accumulate up to 750 hours of JWST observing time, far exceeding the depth and area of any previous deep field campaign and enabling statistical studies of early galaxy populations.
The Cosmic Evolution Early Release Science (CEERS) program contributed early photometric catalogs by imaging known deep fields with NIRCam shortly after JWST began science operations. CEERS identified numerous candidate galaxies at photometric redshifts ranging from z ≈ 9 to beyond z = 15, many of which awaited spectroscopic follow up. The GLASS (Grism Lens-Amplified Survey from Space) program used gravitational lensing by massive galaxy clusters to magnify background galaxies, pushing detection limits even deeper and revealing some of the faintest high redshift sources yet observed.
Together, these surveys established the observational foundation for understanding galaxy formation in the first billion years. By distributing observing time across multiple programs with overlapping fields and complementary strategies, JWST maximizes the return from each hour of integration and builds datasets that support a wide range of science questions beyond simply counting early galaxies.
Key survey accomplishments include:
- Spectroscopic confirmation of galaxies at redshifts z = 13.20, 12.63, 11.58, and 10.38 by JADES, setting confirmed distance records.
- Photometric identification of dozens of candidate z > 9 galaxies by CEERS and other early release programs, building target lists for follow up.
- Coordination across programs to reach planned exposure totals of 750 hours for JADES, ensuring statistical samples large enough to constrain galaxy formation models.
Physical Properties JWST Measures in the Earliest Galaxies
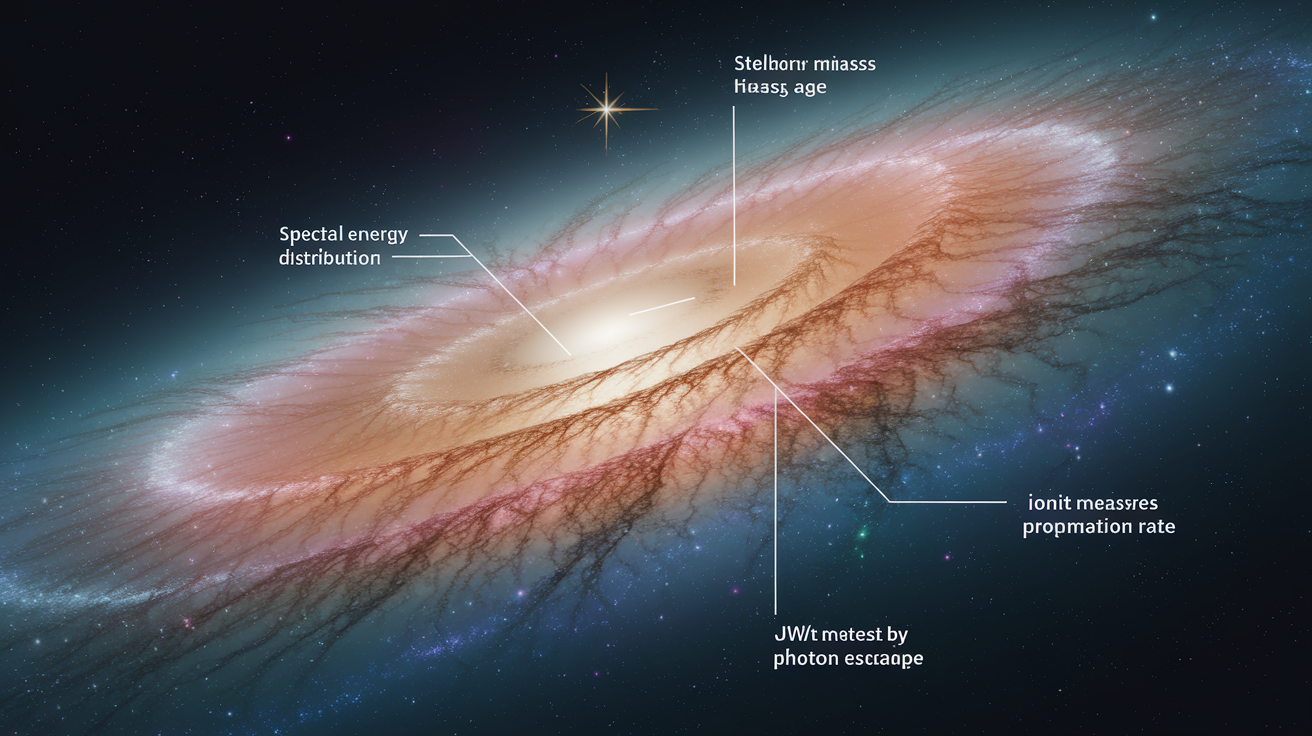
Once a galaxy is confirmed at high redshift, JWST’s spectroscopy and photometry reveal its physical properties through spectral energy distribution (SED) fitting and emission line analysis. SED models compare observed brightnesses across many filters to libraries of model galaxy spectra that vary in stellar age, mass, dust content, and star formation history. By finding the best fitting model, astronomers estimate the galaxy’s stellar mass, the age of its stars, and its current rate of star formation.
Galaxies at z > 10 detected by JADES show stellar ages between roughly 16 and 71 million years, indicating that star formation began when the universe was even younger, sometimes only a few tens of millions of years after the Big Bang. Stellar masses are comparable to the Small Magellanic Cloud, a dwarf satellite of the Milky Way. Total stellar content clocks in at a few hundred million solar masses. Star formation rates exceed ten times those of similar mass galaxies today, producing stars at rates above one solar mass per year and generating surface densities of star formation comparable to the most vigorous local starburst galaxies.
Some early galaxies show evidence that more than 50 percent of the ionizing photons produced by their stars escape into intergalactic space rather than being absorbed by gas within the galaxy. High escape fractions are important for cosmic reionization, the process by which ultraviolet light from the first galaxies ionized the neutral hydrogen filling the universe. If many early galaxies allow half or more of their ionizing photons to escape, they collectively contribute enough radiation to drive reionization, explaining the transition from a neutral to an ionized universe observed at redshifts around z ≈ 6 to 7.
Refining the Early-Galaxy Census: Why Initial JWST Results Seemed to Break the Universe

Early photometric catalogs from JWST’s first observations suggested an unexpected abundance of bright galaxies at very high redshifts, prompting headlines about results that might challenge the standard cosmological model. Some candidate galaxies appeared to have stellar masses or luminosities difficult to reconcile with models of structure formation in the first few hundred million years. The apparent tension led to speculation about missing physics in galaxy formation models or even modifications to the expansion history or matter content of the universe.
Three years of follow up spectroscopy and improved modeling have clarified the picture. About 20 galaxies at redshifts beyond z = 10 have now been confirmed spectroscopically, a sample large enough to begin statistical comparisons but still small enough that cosmic variance and selection effects can skew results. Many early photometric redshift estimates were revised downward after spectroscopy revealed that candidates were actually at lower redshifts, sometimes z ≈ 5 to 7 rather than z > 12, or were misidentified foreground objects. The apparent overabundance eased as the sample of reliable confirmations grew and photometric techniques improved.
Refined models of galaxy formation also reduce the tension. Allowing for bursty star formation, where galaxies build stars in short, intense episodes rather than at steady rates, increases the predicted number of bright systems at early times. Lower dust content in early galaxies boosts their observed brightness without requiring more stars, and contributions from accreting supermassive black holes (active galactic nuclei) can add luminosity that photometric models might misattribute to stars. Improved SED fitting that accounts for these factors brings observations into better agreement with predictions from the standard ΛCDM cosmology.
Interlopers and Modeling Bias
Photometric redshift estimates rely on matching observed colors to template spectra, but templates that omit strong emission lines, dust features, or unusual stellar populations can produce incorrect redshifts. A galaxy at z ≈ 5 with strong emission lines in the rest frame optical can mimic the colors of a z > 12 dropout if the emission lines boost brightness in filters that happen to overlap the lines’ redshifted wavelengths. Dust reddening, where intervening dust absorbs blue light and scatters red light, can shift a galaxy’s colors to resemble a higher redshift object.
Spectroscopy breaks these degeneracies by revealing the actual wavelengths of emission and absorption features. A supposed z = 15 candidate might show a spectrum dominated by emission lines at wavelengths corresponding to z = 6, immediately ruling out the high redshift interpretation. Improved photometric techniques now incorporate more realistic templates, account for emission line contributions, and cross-check results against spectroscopic subsamples, reducing the rate of misidentifications and producing more reliable candidate lists for future follow up.
Final Words
We saw JWST turn stretched ultraviolet into infrared light, use NIRCam dropouts and deep mosaics to pull faint sources out of the noise, then use NIRSpec spectra to pin down redshifts.
Those steps produced detections at z≈10–13 and measurements of stellar ages, masses, and star-formation activity.
If you’re wondering how did JWST detect the earliest galaxies, the short answer is infrared sensitivity plus clever filter strategies and spectroscopy, and more confirmations are coming, so the picture of cosmic dawn keeps getting clearer.
FAQ
Q: How did JWST detect the earliest galaxies?
A: JWST detected the earliest galaxies by capturing ultraviolet light stretched into the infrared by cosmic expansion, using NIRCam dropouts across filters and confirming candidates with NIRSpec spectroscopy.
Q: What is the Lyman‑break or dropout technique?
A: The Lyman‑break (dropout) technique identifies galaxies whose ultraviolet light is absorbed shortward of 912 Å, so they disappear in bluer filters once that break is redshifted into NIRCam bands.
Q: Why is JWST’s infrared sensitivity critical for finding early galaxies?
A: JWST’s infrared sensitivity is critical because it detects UV light stretched to 0.6–5 µm, allowing observation of z≈10–15 galaxies that are invisible at optical wavelengths.
Q: How does JWST’s thermal and engineering design enable faint infrared detection?
A: JWST’s thermal and engineering design keeps instruments near 40 K with passive cooling and low‑noise detectors, cutting background and making extremely faint infrared signals measurable.
Q: How does NIRCam’s survey workflow find high‑redshift candidates?
A: NIRCam’s workflow finds high‑z candidates by choosing filter sets, planning mosaics and long integrations (for example JADES’s deep 10‑day imaging), then extracting photometry to build candidate lists.
Q: How does NIRSpec confirm redshifts?
A: NIRSpec confirms redshifts by taking spectra with a microshutter array to reveal Lyman breaks and emission lines; long exposures separate true high‑z galaxies from low‑redshift interlopers.
Q: Why can JWST see galaxies Hubble could not?
A: JWST can see galaxies Hubble could not because its 6.5‑meter mirror collects about 7.3× more light, it operates colder, and it reaches far longer infrared wavelengths.
Q: What role do deep‑field imaging strategies play in early‑universe discovery?
A: Deep‑field strategies use very long exposures, repeated pointings, and stacking (for fields like GOODS‑South) to raise signal‑to‑noise and reveal extremely faint, distant galaxies.
Q: How do astronomers convert redshift into cosmic age?
A: Astronomers convert redshift into cosmic age using ΛCDM cosmological parameters (H0 and matter density); for example, z≈10 ≈500 million years after the Big Bang, z≈15 ≈250–300 million years.
Q: Which survey programs enabled these record‑breaking discoveries?
A: Survey programs like JADES, CEERS and GLASS supplied deep imaging and spectroscopy; JADES has confirmed multiple z>10 galaxies and plans hundreds of JWST observing hours.
Q: What physical properties does JWST measure in the earliest galaxies?
A: JWST measures stellar masses and ages, star‑formation rates, metallicity and ionizing‑photon escape fractions using spectral energy distributions and spectroscopy to infer galaxy growth and impact.
Q: Why were some early JWST results revised and fewer galaxies confirmed?
A: Early JWST photometric catalogs were revised because emission lines, dust, and template limits biased redshift estimates; later spectroscopy removed many interlopers, leaving about 20 spectroscopically confirmed z>10 galaxies.