
Satellites are often the first responders after a quake, flood, or wildfire, sometimes before anyone on the ground can get a clear look.
When roads are blocked and power is out, Earth observation satellites map damage, track spreading hazards, and point teams toward survivors within hours.
They turn messy, dangerous scenes into clear, actionable maps and data.
This post explains how those sensors and images become the real-time intelligence that guides search, rescue, and aid delivery, and why that speed can mean the difference between life and death.
How Satellites Support Disaster Response With Immediate, Actionable Information
When disasters hit and ground systems go dark, Earth observation satellites overhead become the only reliable source of intelligence. Within hours of an earthquake, flood, or wildfire, these sensors can map what’s broken, track where the danger’s spreading, and show rescue teams where survivors are likely waiting. It’s not guesswork anymore. It’s data.
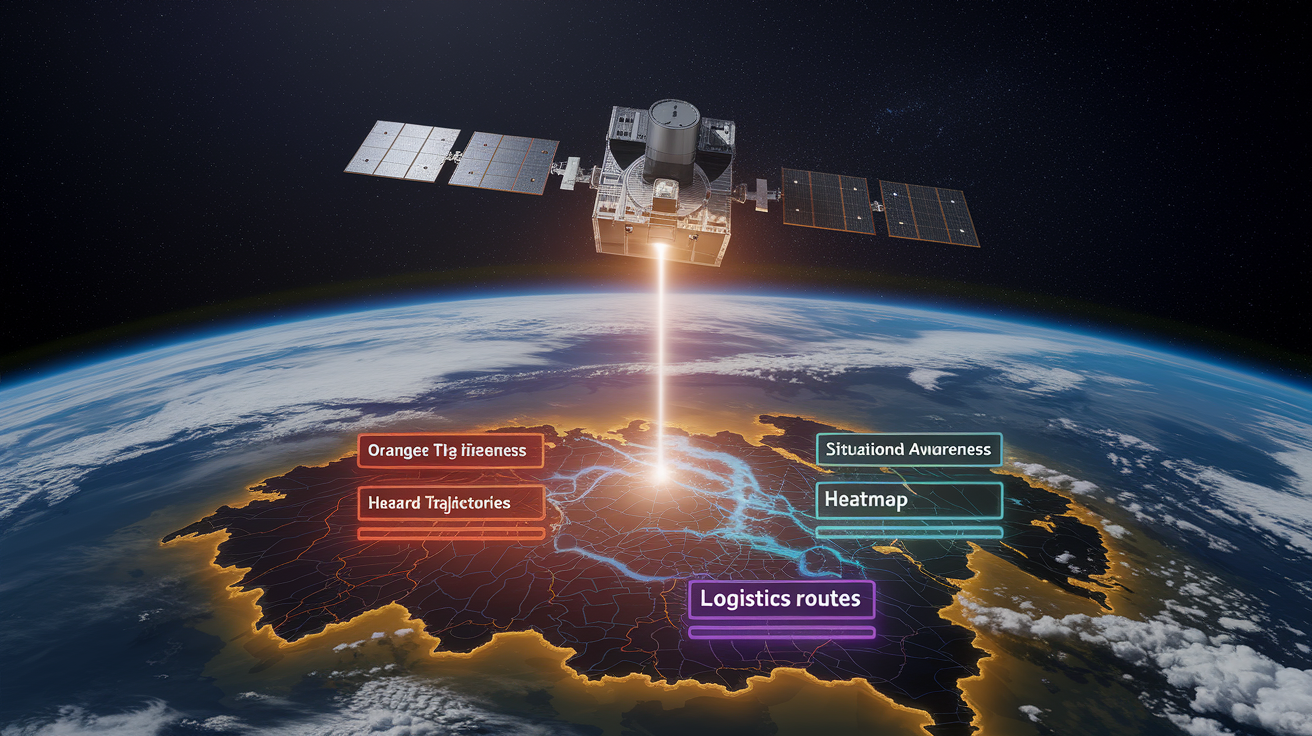
Satellite imagery turns chaos into clarity through four core contributions:
Situational awareness: Satellites reveal damage across areas too big or too dangerous for helicopters or drones to survey safely.
Damage mapping: Side-by-side comparisons using optical and radar sensors show exactly which buildings collapsed, which roads flooded, and which neighborhoods got cut off.
Hazard tracking: Active fire lines, rising water, storm trajectories, volcanic ash. Satellites watch these threats evolve in real time.
Logistics support: Where people fled, which roads still work, which hospitals can still function. All of it feeds into decisions about where aid goes first.
Remote sensing pulls from different sensor types working together. Synthetic aperture radar cuts through clouds and works at night, critical when storms or smoke block the view. Optical satellites deliver sharp pictures you can recognize—roofs, streets, coastlines. Thermal sensors catch heat signatures to locate fires and assess burns. Multispectral instruments measure water content and vegetation stress. International programs like Copernicus and the Group on Earth Observations pool these assets so any country facing catastrophe can request the data, often same-day.
Core Satellite Technologies Used in Disaster Response
Different disasters need different intelligence. Satellites carry specialized sensors to deliver it.
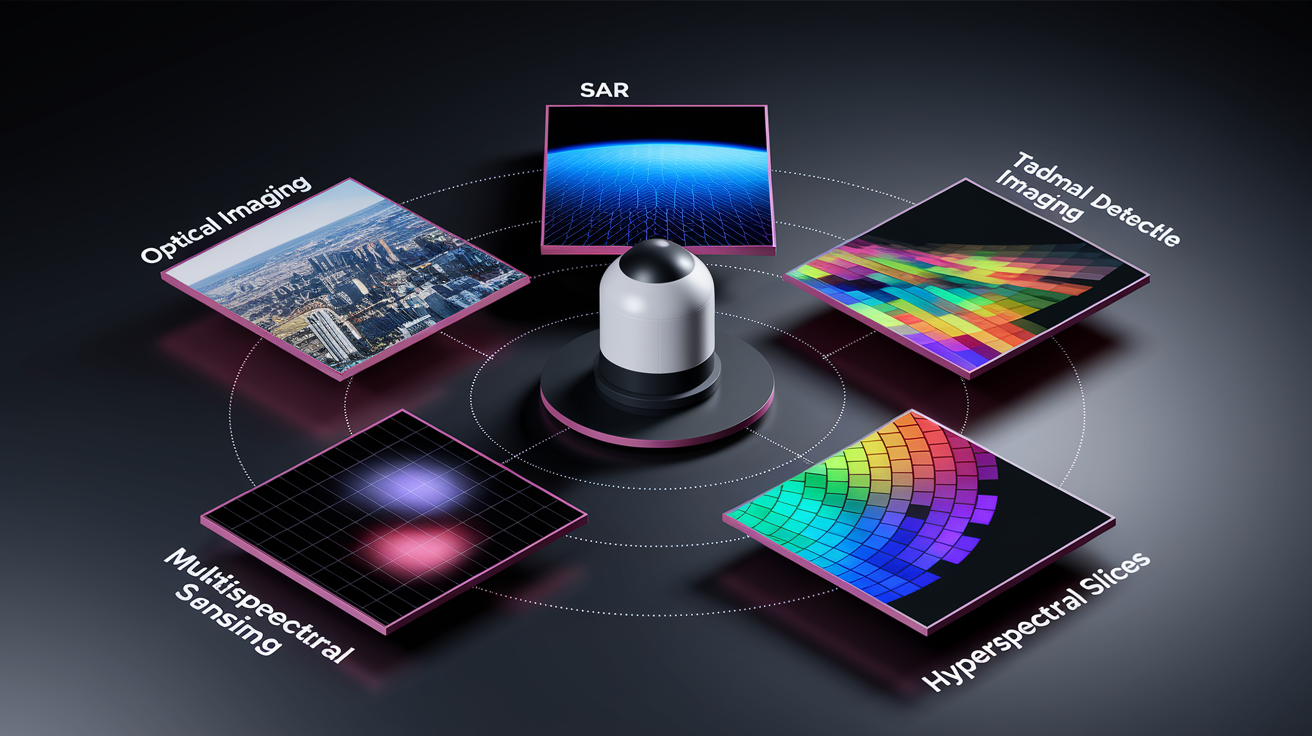
Optical imagers capture familiar scenes: streets, buildings, harbors. Resolutions fine enough to count individual homes. SAR sends its own radar pulses and reads the bounce-back, building images even when thick cloud or ash would blind a camera. Thermal sensors detect temperature differences invisible to your eye, revealing hotspots and burn scars. Multispectral instruments sample light across several wavelength bands, exposing shifts in moisture, plant health, surface composition. Hyperspectral sensors take it further, splitting light into hundreds of narrow channels to identify materials and chemical fingerprints.
Each type brings something specific to disaster ops:
Synthetic aperture radar (SAR): Works day and night, punches through clouds and smoke, maps floods hidden under tree canopy, detects ground shifts after quakes.
Optical imaging: High resolution, visually intuitive. Perfect for damage surveys when skies cooperate.
Thermal detection: Measures surface temperature to find active fire fronts, mark burn zones, monitor volcanic heat.
Multispectral imaging: Combines visible and infrared bands to check vegetation stress, map water extent, estimate soil moisture.
Hyperspectral sensing: Analyzes detailed spectral signatures to spot hazardous materials, map minerals in landslide zones, assess water quality after chemical spills.
| Sensor Type | Strength | Disaster Uses |
|---|---|---|
| Synthetic Aperture Radar (SAR) | All-weather, day/night operation; penetrates clouds and vegetation | Flood mapping, earthquake deformation, building damage under cloud cover |
| Optical Imaging | High spatial resolution; visually interpretable images | Damage assessment, road network mapping, infrastructure monitoring |
| Thermal / Multispectral | Detects heat and moisture differences invisible to visible light | Wildfire front tracking, burn severity mapping, vegetation stress monitoring |
Monitoring Floods, Wildfires, Earthquakes, and Storms From Orbit
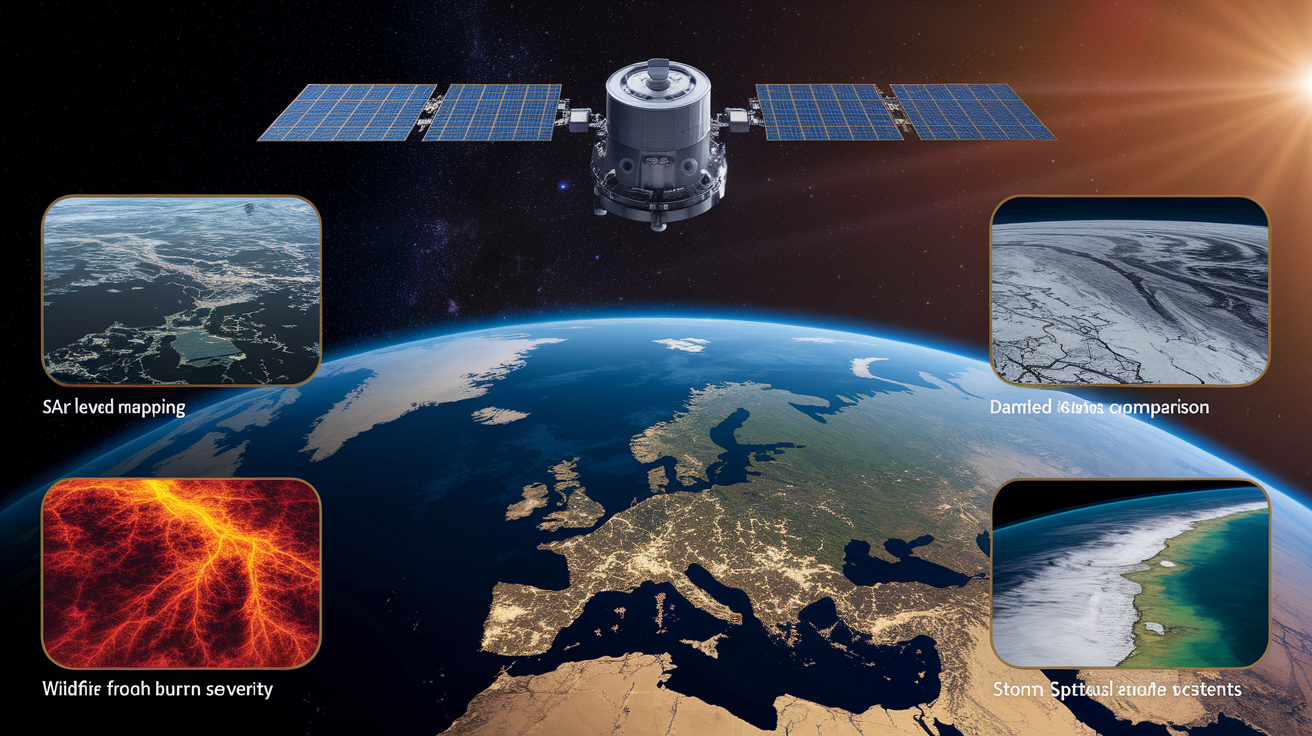
Flood mapping leans heavily on SAR. Water looks dark in radar images, creating sharp contrast with dry ground. SAR sees through the clouds that come with storms, delivering flood boundaries even while rain’s still falling. Multispectral sensors add context by measuring moisture in soil and plants, helping forecasters predict where water will move next. Together, you get inundation maps showing which neighborhoods are underwater, which roads still work, where to set up shelters.
Wildfire detection and tracking combines thermal and multispectral data. Thermal sensors flag temperature spikes marking the fire’s leading edge, sometimes before anyone on the ground reports flames. Multispectral imaging compares near-infrared and shortwave infrared bands to gauge vegetation damage, creating burn severity maps that sort areas into unburned, scorched, or consumed. These maps guide rehab efforts and flag zones at high risk for erosion and debris flows when the rains come.
Earthquake damage mapping uses optical and SAR change detection to count collapsed buildings and measure ground shifts. High-res optical satellites grab before and after shots. Analysts compare roof shapes, shadows, street layouts to spot failures. SAR-derived damage-proxy maps measure tiny changes in how radar bounces off buildings. A shift in scatter often means cracked walls or caved roofs. You get damage assessments within days of a major quake, even when aftershocks and wrecked infrastructure keep ground teams out.
Storm surge and coastal flooding pulls multispectral and radar datasets together. Satellites measure sea surface height and wave patterns before landfall, then switch to flood mapping as surge pushes inland. SAR images show how far seawater reached. Multispectral sensors estimate water depth by checking how much light reflects through shallow flood zones. The maps inform evacuation orders, guide rescue boats, help engineers assess levee performance after the storm passes.
Rapid Mapping, Change Detection, and Automated Damage Assessment
Rapid mapping kicks off the moment a disaster triggers a satellite request. Operators pull archive imagery from weeks or months earlier, then schedule fresh passes over the affected zone as soon as orbits allow. When new imagery arrives, analysts overlay before and after scenes, hunting changes in texture, brightness, shape. Buildings that looked intact before but now appear dark or irregular get flagged as damaged. Roads that were clear but now show debris or water get marked impassable. Cartographers turn these findings into color-coded damage maps, delivered to emergency managers within hours or days.
Automated damage assessment speeds things up using deep learning models trained to recognize destruction patterns. Machine learning segments satellite images into buildings, roads, vegetation, water, then compares pre- and post-event labels to count changes. A building tagged “intact” before an earthquake but “collapsed” after increments the damage tally without manual checking. These models get better with each disaster as training sets grow. They handle repetitive scanning of thousands of structures faster than people can. AI workflows produced damage-proxy maps during the 2023 Hawaii wildfires, getting operational guidance to responders on the ground fast.
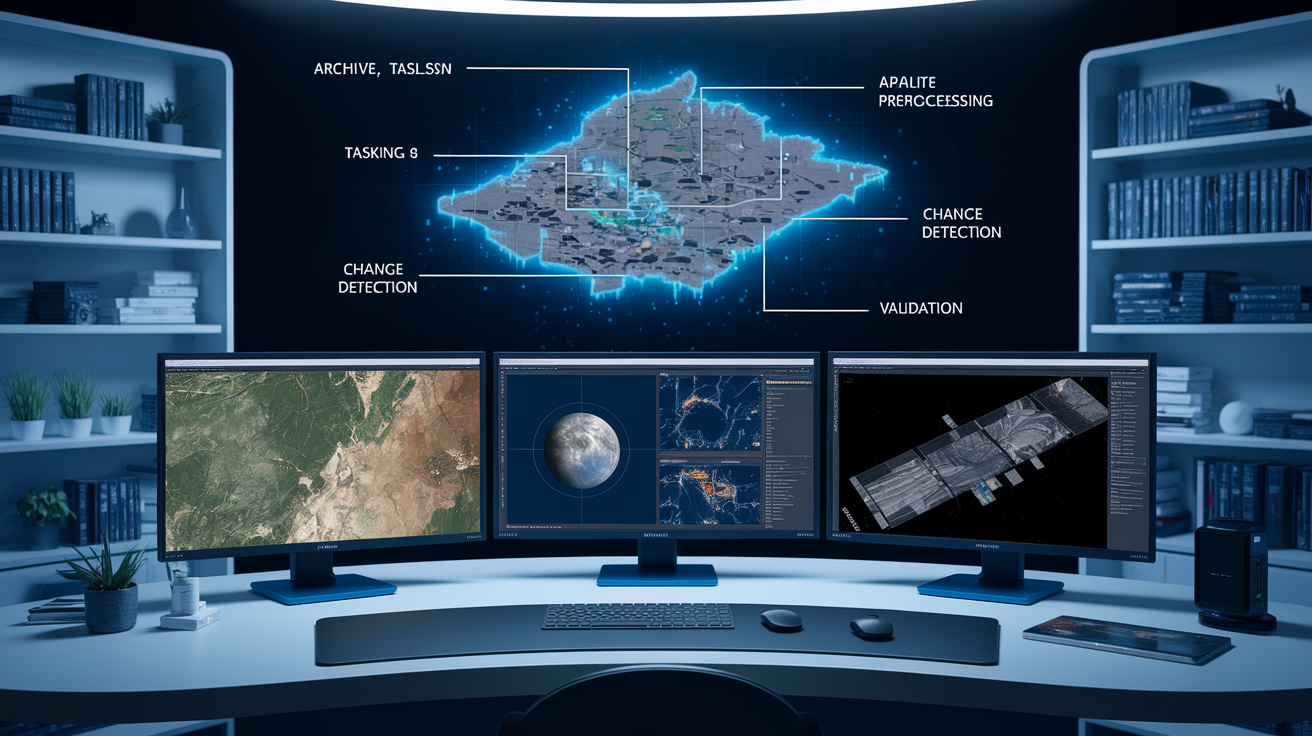
Typical rapid mapping steps:
Archive search to find recent, cloud-free baseline imagery over the disaster zone.
Satellite tasking to schedule high-priority passes within hours of the event.
Download and preprocessing, including atmospheric correction and geometric alignment.
Change detection comparing archive and fresh imagery to spot damaged areas.
Expert validation and cartographic cleanup to remove false hits and clarify features.
Product delivery in standard formats (GeoTIFF, shapefiles, web map services) that emergency ops centers can actually use.
How Satellite Data Guides Emergency Workers and Humanitarian Logistics

Road network analysis helps responders find safe routes in and spot blockages stranding survivors. Optical imagery shows fallen trees, collapsed bridges, debris piles covering highways. SAR checks whether a road surface is still intact under floodwater or washed away. Analysts trace passable corridors on maps and overlay population density, prioritizing routes reaching the most people. Evacuation planning runs the same logic backward, finding clear paths out before conditions get worse.
Population displacement estimation uses night lights, settlement mapping, change detection to estimate how many fled. When power grids fail, night sensors show dark neighborhoods that were lit before, signaling abandoned or wrecked areas. Daytime imagery tracks new temporary shelters, tent camps, informal settlements in fields and parks. Humanitarian logistics layers this displacement data onto damaged infrastructure maps, calculating where to position supply depots, medical stations, water points for max coverage.
Critical infrastructure monitoring tracks power plants, water treatment, hospitals, airports, cell towers. Satellites flag facilities with visible roof damage, flooded yards, blocked access roads. These checks inform which services can restart quickly and which need urgent repair or temporary replacements.
| Operational Need | Satellite Input | How It Helps Responders |
|---|---|---|
| Route planning for rescue teams | Optical and SAR road accessibility mapping | Identifies passable corridors and blockages, reducing travel time to survivors |
| Shelter and aid distribution | Population displacement and density maps | Guides placement of supply depots and medical stations to reach the most people |
| Critical infrastructure triage | Damage assessment of power, water, and medical facilities | Prioritizes repair crews and temporary service deployments |
| Evacuation planning | Hazard extent and road condition mapping | Charts safe exit routes before floodwaters rise or fires advance |
Major Programs: Copernicus EMS, International Charter, and Global Collaboration
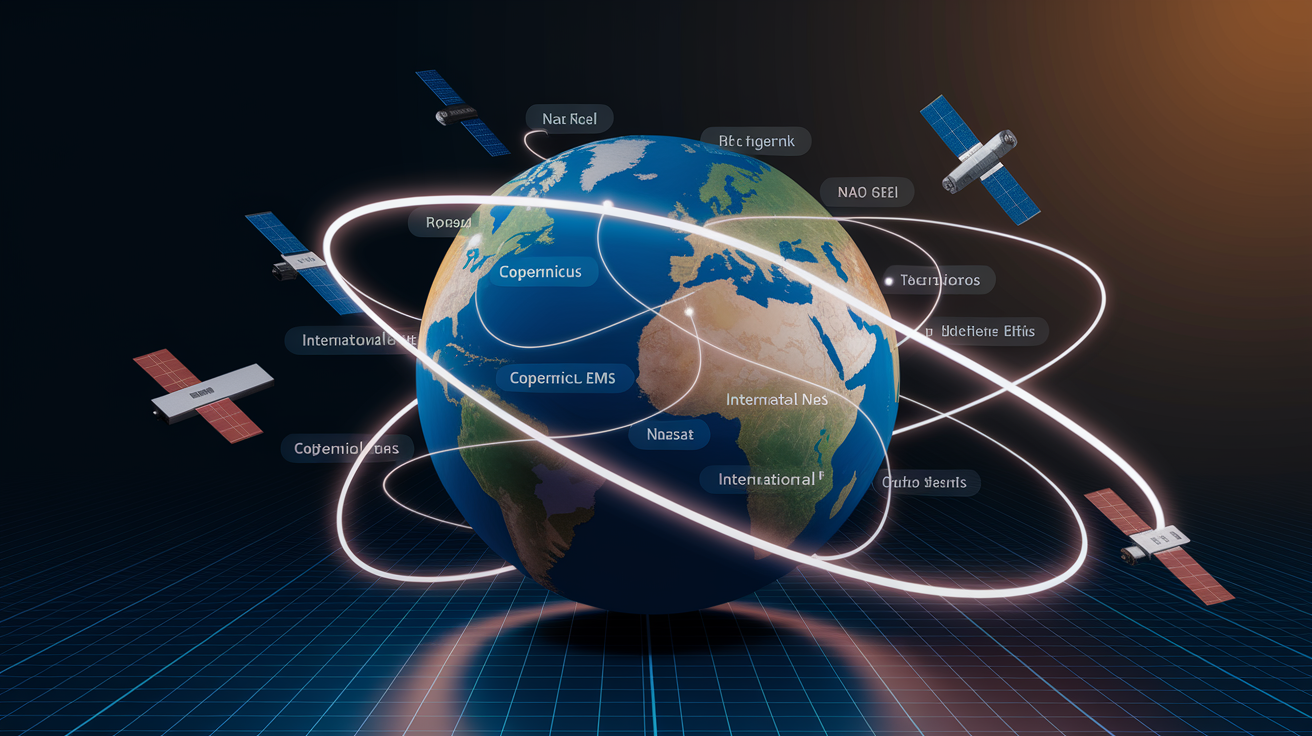
The International Charter “Space and Major Disasters” pools roughly 270 satellites and expertise from 17 space agencies. Activated more than 800 times since 2000, supporting 131 countries. Over 400 requests for floods, nearly 130 for storms and hurricanes. National disaster authorities trigger the Charter at no cost. Satellite operators worldwide respond by tasking sensors to image the zone. Imagery and analysis flow to emergency managers within hours or days, depending on clouds and satellite schedules.
Copernicus Emergency Management Service complements the Charter by offering free rapid mapping to EU member states and, when capacity allows, countries outside the EU. Copernicus runs a dedicated team producing detailed damage grading maps, reference maps, delineation products. Open data policies mean anyone with internet can download the maps and source imagery, building transparency and letting local analysts craft custom products for their communities.
UNOSAT, the UN satellite analysis program, focuses on humanitarian crises in conflict zones and low-capacity regions. Analysts map refugee camps, assess infrastructure damage in areas too dangerous for ground teams, monitor environmental decay compounding disaster risk. The program trains local staff in image interpretation, building long-term capacity so countries can respond on their own next time.
Key roles:
International Charter: Coordinates multinational satellite tasking. Delivers imagery and analysis to national authorities free. Activated for floods, quakes, storms, wildfires, volcanic eruptions.
Copernicus EMS: Free rapid mapping with detailed damage grading. Supports EU and non-EU requests. Maintains open data access.
UNOSAT: Humanitarian crises and conflict zones. Training and capacity building. Maps refugee camps, infrastructure damage, environmental risks.
NASA and other national programs: Archive imagery, experimental sensors, research collaborations. Algorithm dev and validation.
Group on Earth Observations (GEO): Data sharing and interoperability standards across international programs, making sure maps and datasets from different sources play nice together.
Timeliness, Revisit Rates, and Satellite Tasking During Emergencies
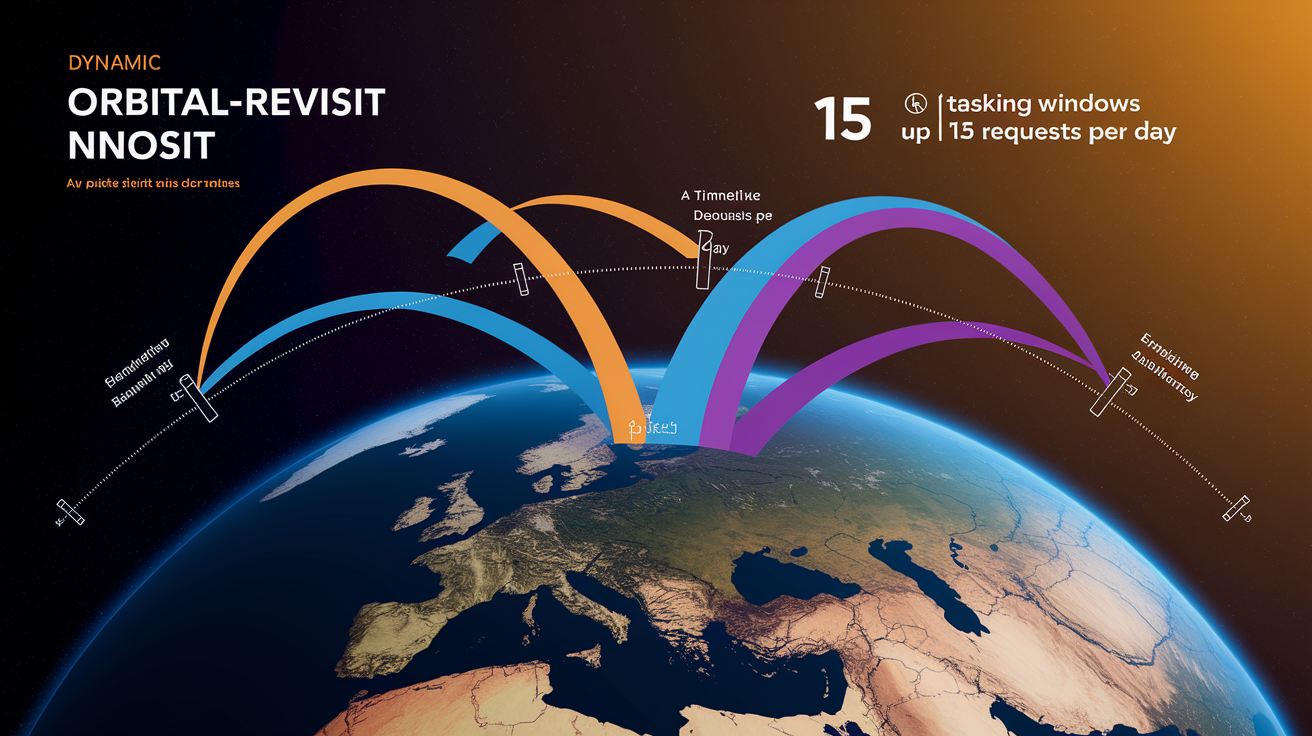
Satellite revisit time sets how fast you get updated imagery after disaster strikes. A constellation with daily global coverage images the same spot every 24 hours. A single satellite in sun-synchronous orbit might take several days to circle back. Pléiades Neo satellites show what rapid response looks like: each schedules roughly 15 task requests per day, can be reprogrammed up to 15 minutes before plan upload, revisits the same area twice daily. Operators can pivot from routine imaging to emergency tasking within hours, grabbing a target in the next orbital pass.
Real-time monitoring means balancing spatial resolution, coverage area, temporal resolution. High-res optical satellites deliver sharp building images but cover narrow swaths, limiting ground surveyed per pass. SAR trades some detail for all-weather capability, imaging through clouds day or night. Critical when storms obscure the zone. Analysis latency, the gap between capture and usable map, adds processing time for atmospheric correction, orthorectification, change detection. Even with automation, turning raw pixels into a damage map takes hours. Expert validation can add another day.
Factors hitting timeliness:
Orbital coverage gaps: Polar orbit satellites revisit high latitudes often but may take days returning to equatorial zones. Constellations shrink the gap but can’t erase it.
Sensor tasking queues: High-demand satellites juggle commercial contracts, government priorities, disaster requests. Emergency activations bump routine tasks but still wait for the next available pass.
Weather and illumination: Optical sensors need daylight and clear skies. SAR works in all conditions but may need specialist interpretation and longer processing.
Processing load and automation level: Fully automated pipelines spit rough products quickly. Expert-validated maps take longer but cut false positives and boost usability.
Case Studies Demonstrating the Impact of Earth Observation on Disaster Response
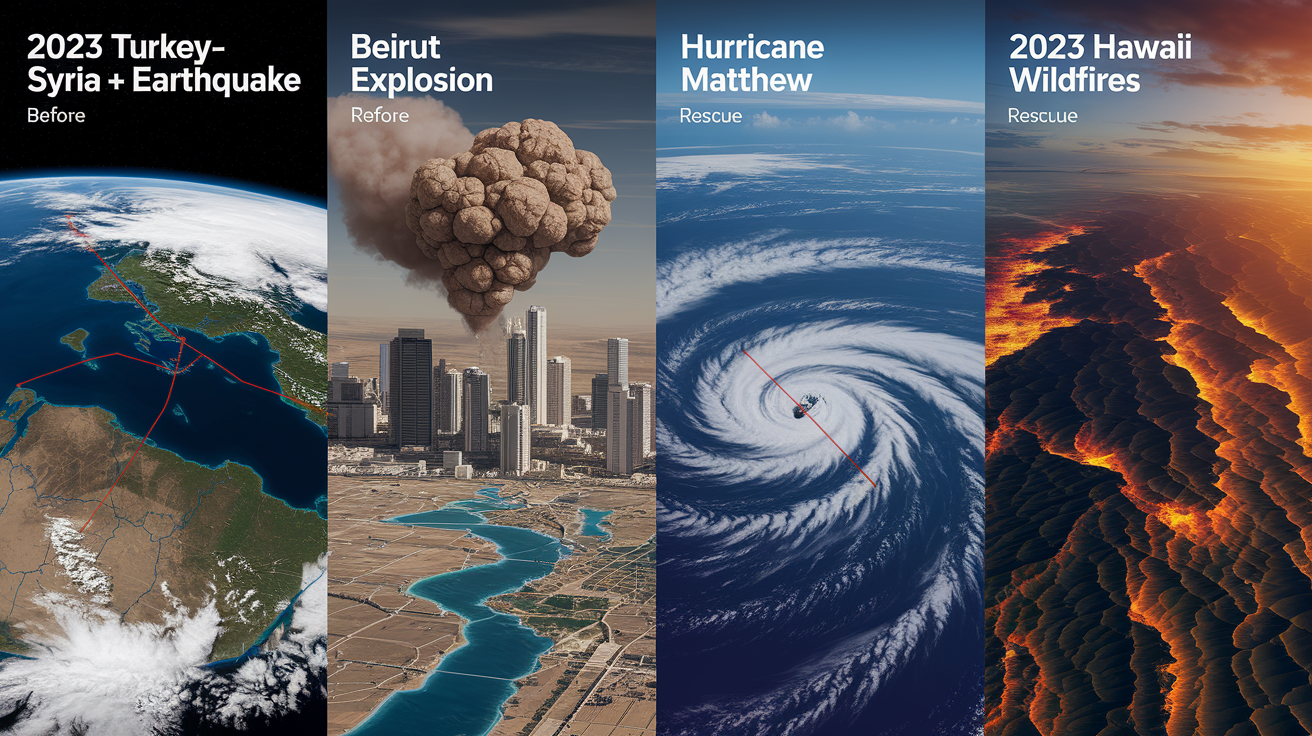
The 2023 Turkey–Syria earthquake hit at 04:17 local time on February 6. National authorities activated the International Charter at 07:04 that same morning. First post-event images transferred the next day, letting rescue coordinators prioritize search zones in Hatay and Iskenderun. More than 350 crisis images from 17 space agencies flowed to ground teams over weeks, mapping building collapses, road blocks, temporary shelter spots. SAR damage-proxy maps flagged neighborhoods with widespread failures, steering international rescue teams to areas where survivors sat trapped under rubble.
The Beirut explosion on August 4, 2020, leveled the port and surrounding blocks in seconds. High-res optical satellites grabbed the blast site within hours, producing detailed damage maps marking concentric destruction zones. Analysts compared pre-explosion imagery to post-blast scenes, sorting buildings into destroyed, heavily damaged, lightly affected. Humanitarian orgs used these maps to estimate displaced residents and plan emergency shelter distribution. Speed and precision of satellite mapping made up for chaos on the ground, where overwhelmed local authorities couldn’t run systematic damage surveys.
Hurricane Matthew hit Haiti on October 4, 2016, as a Category 4 storm with sustained winds topping 230 kilometers per hour (145 mph). Tens of thousands of homes destroyed, over a million people affected. Satellites mapped storm surge flooding along the southern coast, tracked landslides triggered by rain in mountains, monitored road network recovery in weeks after the storm passed. Flood extent maps guided rescue boat deployment and pinpointed communities cut off by washed-out bridges. Months later, change detection measured agricultural recovery, feeding food security assessments and long-term reconstruction planning.
The 2023 Hawaii wildfires burned urban and wildland zones on Maui. SAR-derived damage-proxy maps played a central role. SAR satellites imaged the fire zone through smoke blocking optical sensors, producing maps within 24 hours of containment. Analysts measured shifts in radar backscatter to ID structures that collapsed or burned, overlaying findings onto road maps to guide fire crews and search teams. The damage-proxy approach, comparing radar signal patterns before and after, proved faster than waiting for clear skies and traditional optical change detection.
Data Access, Processing Challenges, and Operational Limitations
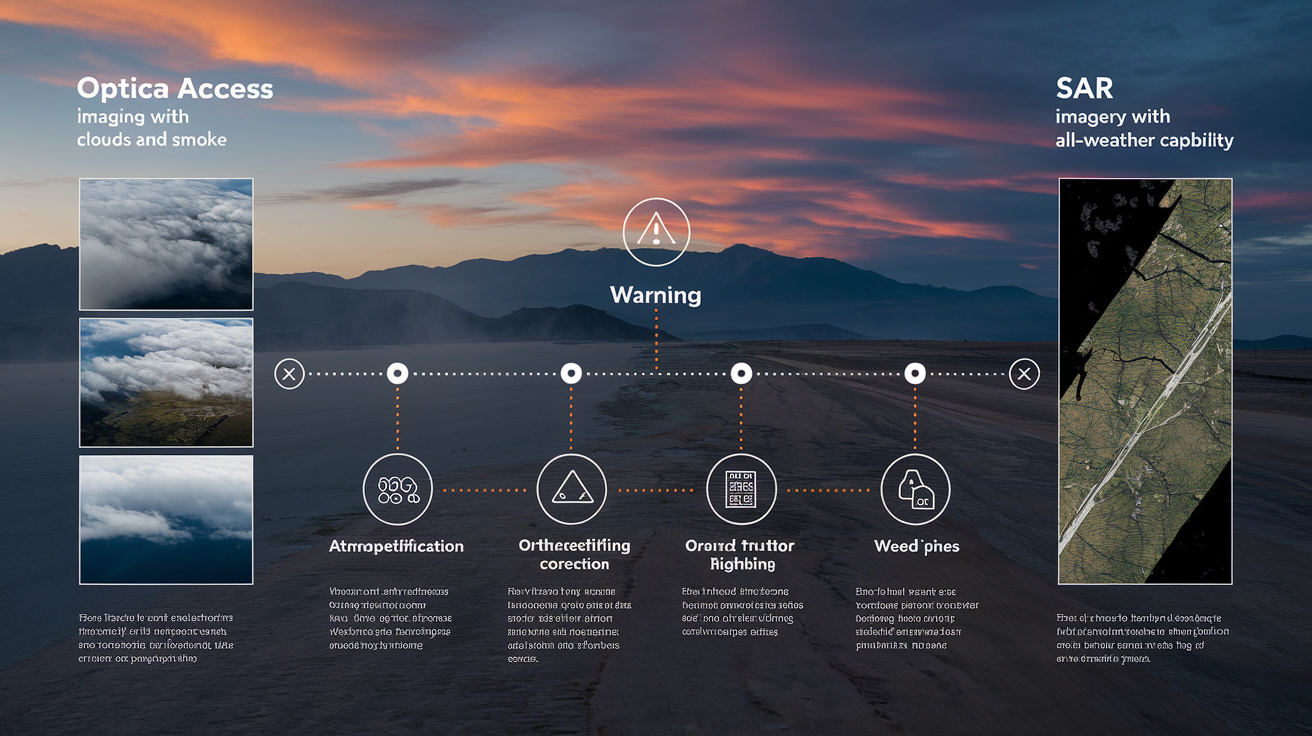
Optical sensor limits start with weather. Clouds, smoke, haze block visible and near-infrared light, making imagery worthless until skies clear. Thick wildfire smoke can linger for days, stalling optical damage assessment exactly when it’s most needed. Night imaging needs moonlight or specialized sensors, and even then shadows hide building details. SAR dodges some of these problems but introduces complexity. Radar images look alien, with geometric warping and speckle noise needing specialist eyes.
Cloud masking and atmospheric correction strip haze and adjust for sunlight scatter, but these steps eat time and can introduce errors if automation mistakes smoke for cloud. Orthorectification fixes geometric distortions from terrain and satellite viewing angles, necessary for accurate change detection. Mosaicking stitches multiple passes into one seamless map, but misalignment at scene edges can fake changes analysts must manually scrub. Ground truthing, field visits verifying satellite classifications, remains essential to catch mistakes. But ground access is often impossible during the disaster itself.
Data licensing and access complicate international response. Some high-res satellites run under commercial licenses restricting data sharing, needing special agreements before imagery reaches humanitarian groups. Processing bottlenecks pop up when multiple disasters hit at once, swamping rapid mapping teams and delaying delivery. Revisit gaps mean some zones go un-imaged for days if clouds stick or satellites get tasked elsewhere.
Key limits:
Optical sensors fail in cloudy, smoky, or dark conditions, delaying damage assessment until weather clears.
SAR interpretation demands specialized training and longer processing to convert radar backscatter into recognizable features.
Revisit gaps and tasking queues create lag between disaster onset and usable imagery, especially for single-satellite systems.
Processing steps (atmospheric correction, orthorectification, mosaicking) introduce delays and potential errors needing expert review.
Ground truthing validates satellite products but often impossible during active emergencies, risking false positives in damage maps.
Future Trends: AI, Mega-Constellations, and Next-Generation Missions

Machine learning for feature extraction is changing how fast satellites turn pixels into decisions. Deep learning models trained on thousands of labeled disaster images now segment buildings, roads, water, vegetation with accuracy near human analysts. Transfer learning lets these models adapt quickly to new disaster types or regions, cutting training data needed to deploy a working classifier. Autonomous pipelines run onboard some satellites, flagging anomalies and beaming only high-priority scenes to ground stations, saving bandwidth and speeding delivery.
Mega-constellations will shrink revisit times from days to hours or minutes. Companies and agencies are launching constellations of dozens or hundreds of small satellites, each packing optical or SAR sensors. With enough satellites in coordinated orbits, any point on Earth gets imaged multiple times per day, ensuring disaster managers get updated intel as conditions shift. Higher-res sensors aboard next-gen missions, some launching around 2028, will resolve individual vehicles and narrow streets, tightening damage assessment accuracy and enabling finer logistics planning.
Research gaps include better fusion of satellite data with ground sensors, social media feeds, citizen reports. Combining these streams into unified situational awareness remains tricky but promises faster, more complete assessments. Training local analysts to interpret imagery and run processing tools closes capacity gaps in low-resource regions, letting countries respond independently rather than waiting for international help.
Key future advances:
AI-based automatic change detection: Real-time ID of damaged buildings, flooded areas, busted infrastructure without manual review, slashing map delivery from days to hours.
Mega-constellations: Dozens or hundreds of small satellites giving multiple daily revisits, ensuring fresh imagery regardless of clouds or tasking delays.
Higher-resolution sensors: Next-gen optical and SAR satellites resolving sub-meter details, improving damage sorting and logistics mapping.
Onboard processing and prioritization: Satellites autonomously flagging disaster features and transmitting only critical data, cutting bandwidth load and speeding ground receipt.
Final Words
In the action, satellites keep crisis teams informed with near-real-time maps, change detection, and sensors that work through clouds or at night. They deliver flood extents, burn-severity maps, road-access updates, and population-movement indicators. SAR, optical, and multispectral data each add a piece of the picture.
The role of earth observation satellites in disaster response is simple: turn space data into fast, usable guidance for responders. It speeds choices, helps prioritize aid, and makes response safer and more effective when time matters.
FAQ
Q: How do satellites support disaster response?
A: Satellites support disaster response by giving rapid situational awareness, real-time images, before/after maps, hazard tracking, damage estimates, and communications help when ground networks fail, letting teams act faster and safer.
Q: What satellite products are delivered after a disaster?
A: Satellite products delivered after a disaster include rapid before/after maps, flood extent and burn-severity maps, road-accessibility overlays, damage-proxy layers, and population-displacement indicators for planning and prioritizing response.
Q: What sensor types do satellites use and what does each show?
A: Sensor types used include SAR, optical, multispectral/thermal, and hyperspectral; SAR sees through clouds and night, optical gives high-detail photos, multispectral/thermal spots heat and moisture, hyperspectral helps identify materials and chemicals.
Q: How do satellites monitor floods, wildfires, earthquakes, and storms?
A: Satellites monitor major hazards by using SAR for flood extent under clouds, thermal and multispectral sensors to track active wildfires and burn severity, optical and SAR change detection for earthquake damage, and radar plus multispectral data for storm surge and coastal flooding.
Q: What is rapid mapping and automated damage assessment?
A: Rapid mapping and automated damage assessment are workflows that compare archive and post-event images, use AI and deep-learning to flag damaged structures, and produce prioritized maps responders can use within hours to days.
Q: How does satellite data guide emergency workers and humanitarian logistics?
A: Satellite data guides emergency workers by showing blocked roads, safe evacuation routes, damaged hospitals or power lines, population concentrations, and optimal supply routes so teams can prioritize deliveries and move safely.
Q: Which international programs provide satellite support in emergencies?
A: International programs providing satellite support include Copernicus EMS for free rapid mapping, the International Charter that pools many satellites for emergency imaging, and UNOSAT offering humanitarian analysis and data sharing.
Q: Why does timing and revisit rate matter, and what affects it?
A: Timing and revisit rate matter because fresh images let teams track fast-changing hazards; factors include satellite tasking queues, sensor revisit schedules, weather or smoke blocking views, and processing and delivery delays.
Q: What are common data access and sensor limitations during disasters?
A: Common data access and sensor limitations are cloud and smoke blocking optical imagery, SAR requiring specialized processing, revisit gaps, licensing or tasking delays, and the need for ground verification to confirm findings.
Q: How will AI and mega-constellations change satellite disaster response?
A: AI and mega-constellations will speed automatic change detection, raise revisit rates, enable near-real-time alerts, reduce manual image sifting, and increase the need for training and open, reliable data access.